Studies Archive
Variation in Type 2 Diabetes Prevalence, Management and Outcomes by Income Level in the Atlanta Metro Area
November 12, 2023Key Takeaways
-
In addition to addressing America’s obesity epidemic, curbing the growing prevalence of type 2 diabetes requires addressing the health disparities experienced by people in minority and underserved populations.
-
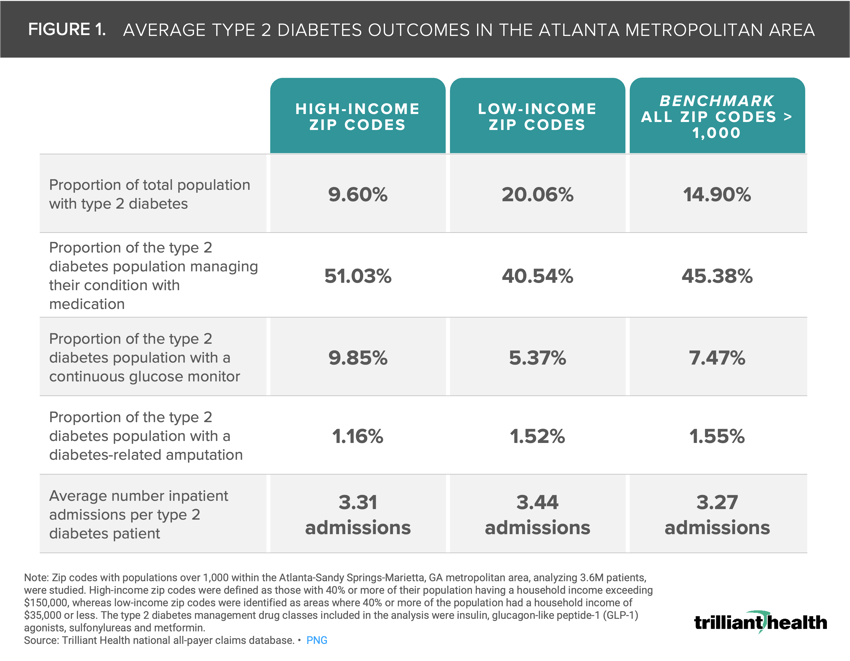
Across all ZIP codes examined, the average type 2 diabetes prevalence was 14.90%, but it differed substantially between high-income (9.60%) and low-income (20.06%) ZIP codes.
-
Fifty-one percent of patients in high-income ZIP codes managed their type 2 diabetes with medication compared to 40.54% in low-income ZIP codes. Patients in high-income ZIP codes (9.85%) used continuous glucose monitors (CGMs) for diabetes management at almost twice the proportion of those in low-income ZIP codes (5.37%).
November marks National Diabetes Awareness Month, culminating in World Diabetes Day on November 14. Despite being a central focus of public health campaigns, clinical research and government funding since 1975, type 2 diabetes continues to increase in prevalence in the U.S.1 The cost of type 2 diabetes is staggering, estimated at $327B.2 This burden is exacerbated by a national shortage of primary care providers, particularly in lower-income neighborhoods, as well as a shortage of type 2 diabetes medications like Ozempic®, caused in part by growing off-label use.3,4
Background
In addition to addressing America’s obesity epidemic, curbing the growing prevalence of type 2 diabetes requires addressing the health disparities experienced by people in minority and underserved populations. According to the CDC National Diabetes Statistics Report, 37.3M Americans (11.3%) have diabetes, with 8.5M of them undiagnosed.5 Additionally, 96M adults are considered prediabetic, equating to 38.0% of all adults. U.S diabetes prevalence is disproportionately higher in non-White populations, populations with lower education levels and populations with family incomes below 100% of the federal poverty level.6 Disparities in access to diabetes care and health outcomes has been well documented in academic literature, with a general understanding of variation by population segments (e.g., race/ethnic groups) and broader geographic areas (e.g., states). However, the impact of disparities in diabetes treatment, such as continuous glucose monitoring, on patient outcomes at a hyper-local level has not been analyzed. Since healthcare is local, market-specific insights about diabetes prevalence, management and outcomes are essential for effective diabetes management strategies.
Analytic Approach
We studied the prevalence and associated outcomes among type 2 diabetes patients residing in low-income and high-income ZIP codes within the Atlanta-Sandy Springs-Marietta, GA metropolitan area. To be included, ZIP codes were required to have a population of more than 1,000 individuals. Specifically, we identified 10 high-income and low-income ZIP codes, collectively encompassing 419K patients. High-income ZIP codes were defined as those with 40% or more of their population having a household income exceeding $150,000, whereas low-income ZIP codes were identified as areas where 40% or more of the population had a household income of $35,000 or less. Using national all-payer claims data, we examined several key parameters within both high-income and low-income ZIP codes. The key outcomes in the analysis included: the prevalence of type 2 diabetes, the proportion of individuals with type 2 diabetes managing their condition through medication, the proportion of patients with a CGM, the proportion of diabetes-related amputations and the average number of inpatient admissions per patient with type 2 diabetes. The type 2 diabetes drug classes included in the medication management analysis were insulin, glucagon-like peptide-1 (GLP-1) agonists, sulfonylureas and metformin.
Findings
Across all ZIP codes, the average type 2 diabetes prevalence was 14.90%, but the rate differed substantially between high-income (9.60%) and low-income (20.06%) ZIP codes (Figure 1). There was a 10.49 percentage point variance between patients in high-income ZIP codes (51.03%) that manage their type 2 diabetes with medication compared to patients in low-income ZIP codes (40.54%). Patients in high-income ZIP codes (9.85%) utilized CGMs for diabetes management at almost twice the proportion of those in low-income ZIP codes (5.37%).
With regard to outcomes, patients in high-income ZIP codes experienced the smallest percentage of amputations (1.16%) and number of inpatient admissions (3.31) relative to low-income ZIP codes.
The disparities in type 2 diabetes prevalence and management between high-income and low-income ZIP codes in the Atlanta metropolitan area result from a complex interplay of income, social determinants, diabetes prevalence, medication access, technology use and health outcomes at the local level. The interplay of these factors differs between markets, meaning that there is no panacea for America’s diabetes crisis. While telehealth is cited as a promising solution, its effectiveness relies on more than commercial and Federal payer investment at scale.7 Moreover, certain interventions designed to reduce health inequities may inadvertently widen the disparity gap. For example, a singular focus on facilitating access – whether it be physical location, financial coverage or something else – does not guarantee widespread adoption. Despite the promise of telehealth and the efficacy of GLP-1 drugs to treat underserved populations, utilization trends reveal that those most in need of these interventions are among those using them the least.
Log in to the Compass+ platform to continue reading about the relationship between ZIP code-level burden of disease and forecasted demand for primary care and orthopedic surgery through 2027.

The economic and health burden facing the U.S. health economy today is unsustainable and at the current rate, the delivery system is not prepared to handle an influx of sicker patients. The higher prevalence of type 2 diabetes in low-income ZIP codes, along with the disparities in medication management and use of continuous glucose monitoring, highlights the urgent need for targeted interventions to address these inequalities. Health economy stakeholders must consider strategies to improve access to type 2 diabetes treatment, enhance early detection and diagnosis, and promote innovative solutions for equitable management, with a focus on underserved populations. While tremendous strides have been made since 1975 in the treatments and tools available for managing and treating diabetes, it is not enough. These innovations can only be considered effective when the populations with the highest need can access them.
Thanks to Matt Fili, Austin Miller and Katie Patton for their research support.
- Social Determinants of Health
- Specialty Care
- Cost of Care
- Life Sciences
- Disease Burden









.png)


.png?width=171&height=239&name=2025%20Trends%20Report%20Nav%20(1).png)

