


.png)


.png?width=171&height=239&name=2025%20Trends%20Report%20Nav%20(1).png)

Part 2 of 2. Assessing Surgical Demand in Under- and Over-Bedded Metropolitan Markets
Study Takeaways
- A market may appear undersupplied in hospital beds relative to national benchmarks but could still meet local demand for high-acuity care, such as surgical services.
- From 2018-2023, outpatient volume of total hip and knee replacements for patients ages 65 and older grew in the CBSAs that we analyzed, regardless of bed oversupply or undersupply. The shift to outpatient settings was comparatively faster in markets with an undersupply of hospital beds, potentially reflecting the low capacity of inpatient care.
- Inpatient demand for total hip and knee replacements for patients ages 65 and older is forecasted to decline in all CBSAs analyzed, regardless of whether the market is over- or under-bedded. The five-year compound annual growth rate (CAGR) from 2023-2028 is expected to range between -7.4% and -5.8%.
In Part 1 of this series, we examined market-level hospital bed availability in major metropolitan CBSAs, a key factor in determining access to healthcare and capacity for care delivery.1 Across the country, markets face varying degrees of hospital bed oversupply or undersupply, which can impact care quality and costs. To accurately assess whether a market is over-bedded or under-bedded, it is essential to evaluate bed capacity relative to localized demand for healthcare services. Comparing actual and projected demand against bed supply helps contextualize how well hospital capacity aligns with population needs. Therefore, in Part 2 of this series, we examine how surgical volumes – specifically total hip and knee replacements – relate to hospital bed ratios in both over- and under-bedded markets, focusing on patients ages 65 and older.
Background
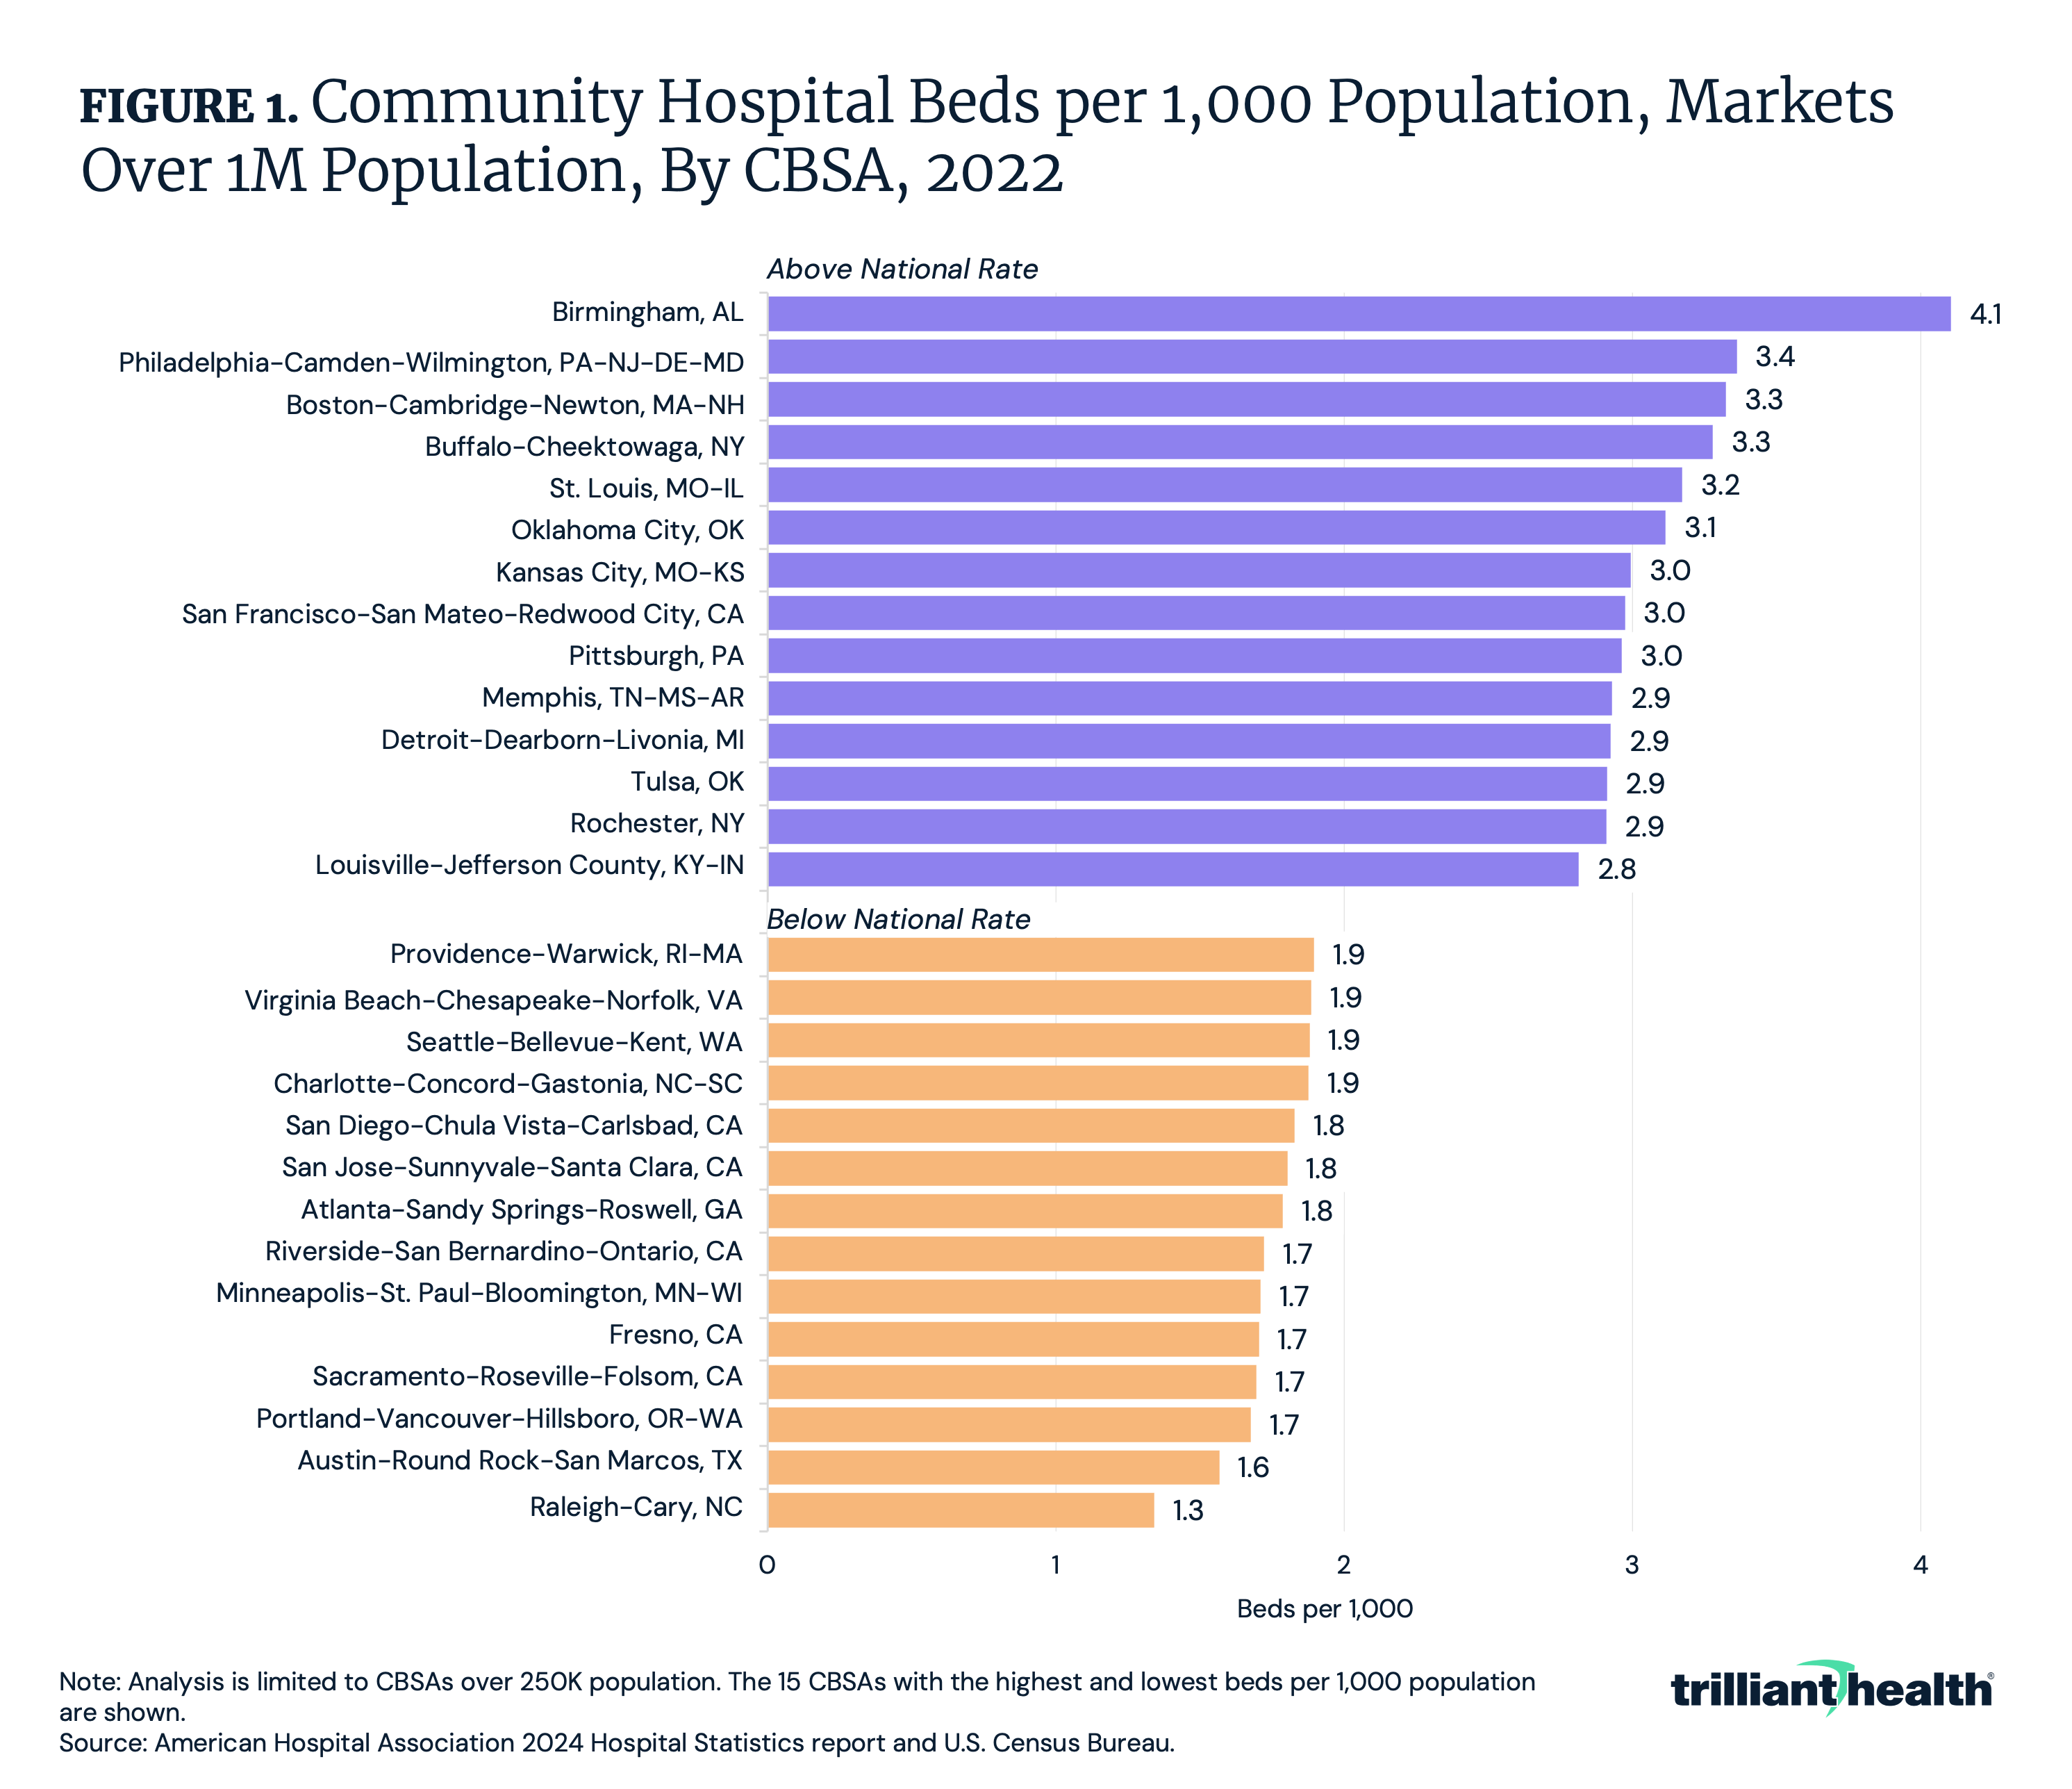
Our findings from Part 1 highlighted potential imbalances in hospital bed availability across CBSAs. While most states and CBSAs have between a rate of 2.0 and 3.2 beds per 1,000 population, many regions have an oversupply and others an undersupply relative to the national rate of 2.35 beds. In larger markets with populations over 1M, bed rates range from 1.3 (Raleigh-Cary, NC) to 4.1 (Birmingham, AL), with 52.2% considered under-bedded (Figure 1). Demographic differences between markets with an oversupply and undersupply of hospital beds suggest likely variations in local surgical demand.
Total hip and knee replacements are among the most common surgical procedures, particularly among older adults, improving mobility, reducing pain and enhancing quality of life. More than 1.3M total hip and/or knee replacements are performed annually in the U.S., with an average patient age of 67.2 and 65.7 for total knee replacement and for total hip replacement, respectively.2,3 Advancements in surgical techniques and postoperative care have fostered the gradual shift to outpatient sites, with 12.2% of total hip and knee replacements performed in outpatient settings in 2022.4
Because the vast majority of total hip and knee replacements are still performed in inpatient settings, hospital bed availability is a key consideration. Markets with an oversupply of beds can more easily meet demand but must also manage excess capacity. Conversely, under-bedded markets may face challenges in meeting demand, potentially leading to delays in care or patients seeking treatment in other markets. Given these dynamics, this study examines how demand for both inpatient and outpatient total hip and knee replacements aligns with bed availability in over- and under-bedded markets, focusing on the 65 and older population.
Analytic Approach
We leveraged our national all-payer claims database and Provider Directory to analyze historical outpatient volume of total hip and knee replacements from 2018 to 2023 and forecasted inpatient demand for total hip and knee replacements through 2028 for patients ages 65 and older, by CBSA. We examined select CBSAs with over 1M population that have an oversupply or undersupply of hospital beds relative to the national rate of 2.35 per 1,000 population.
Findings
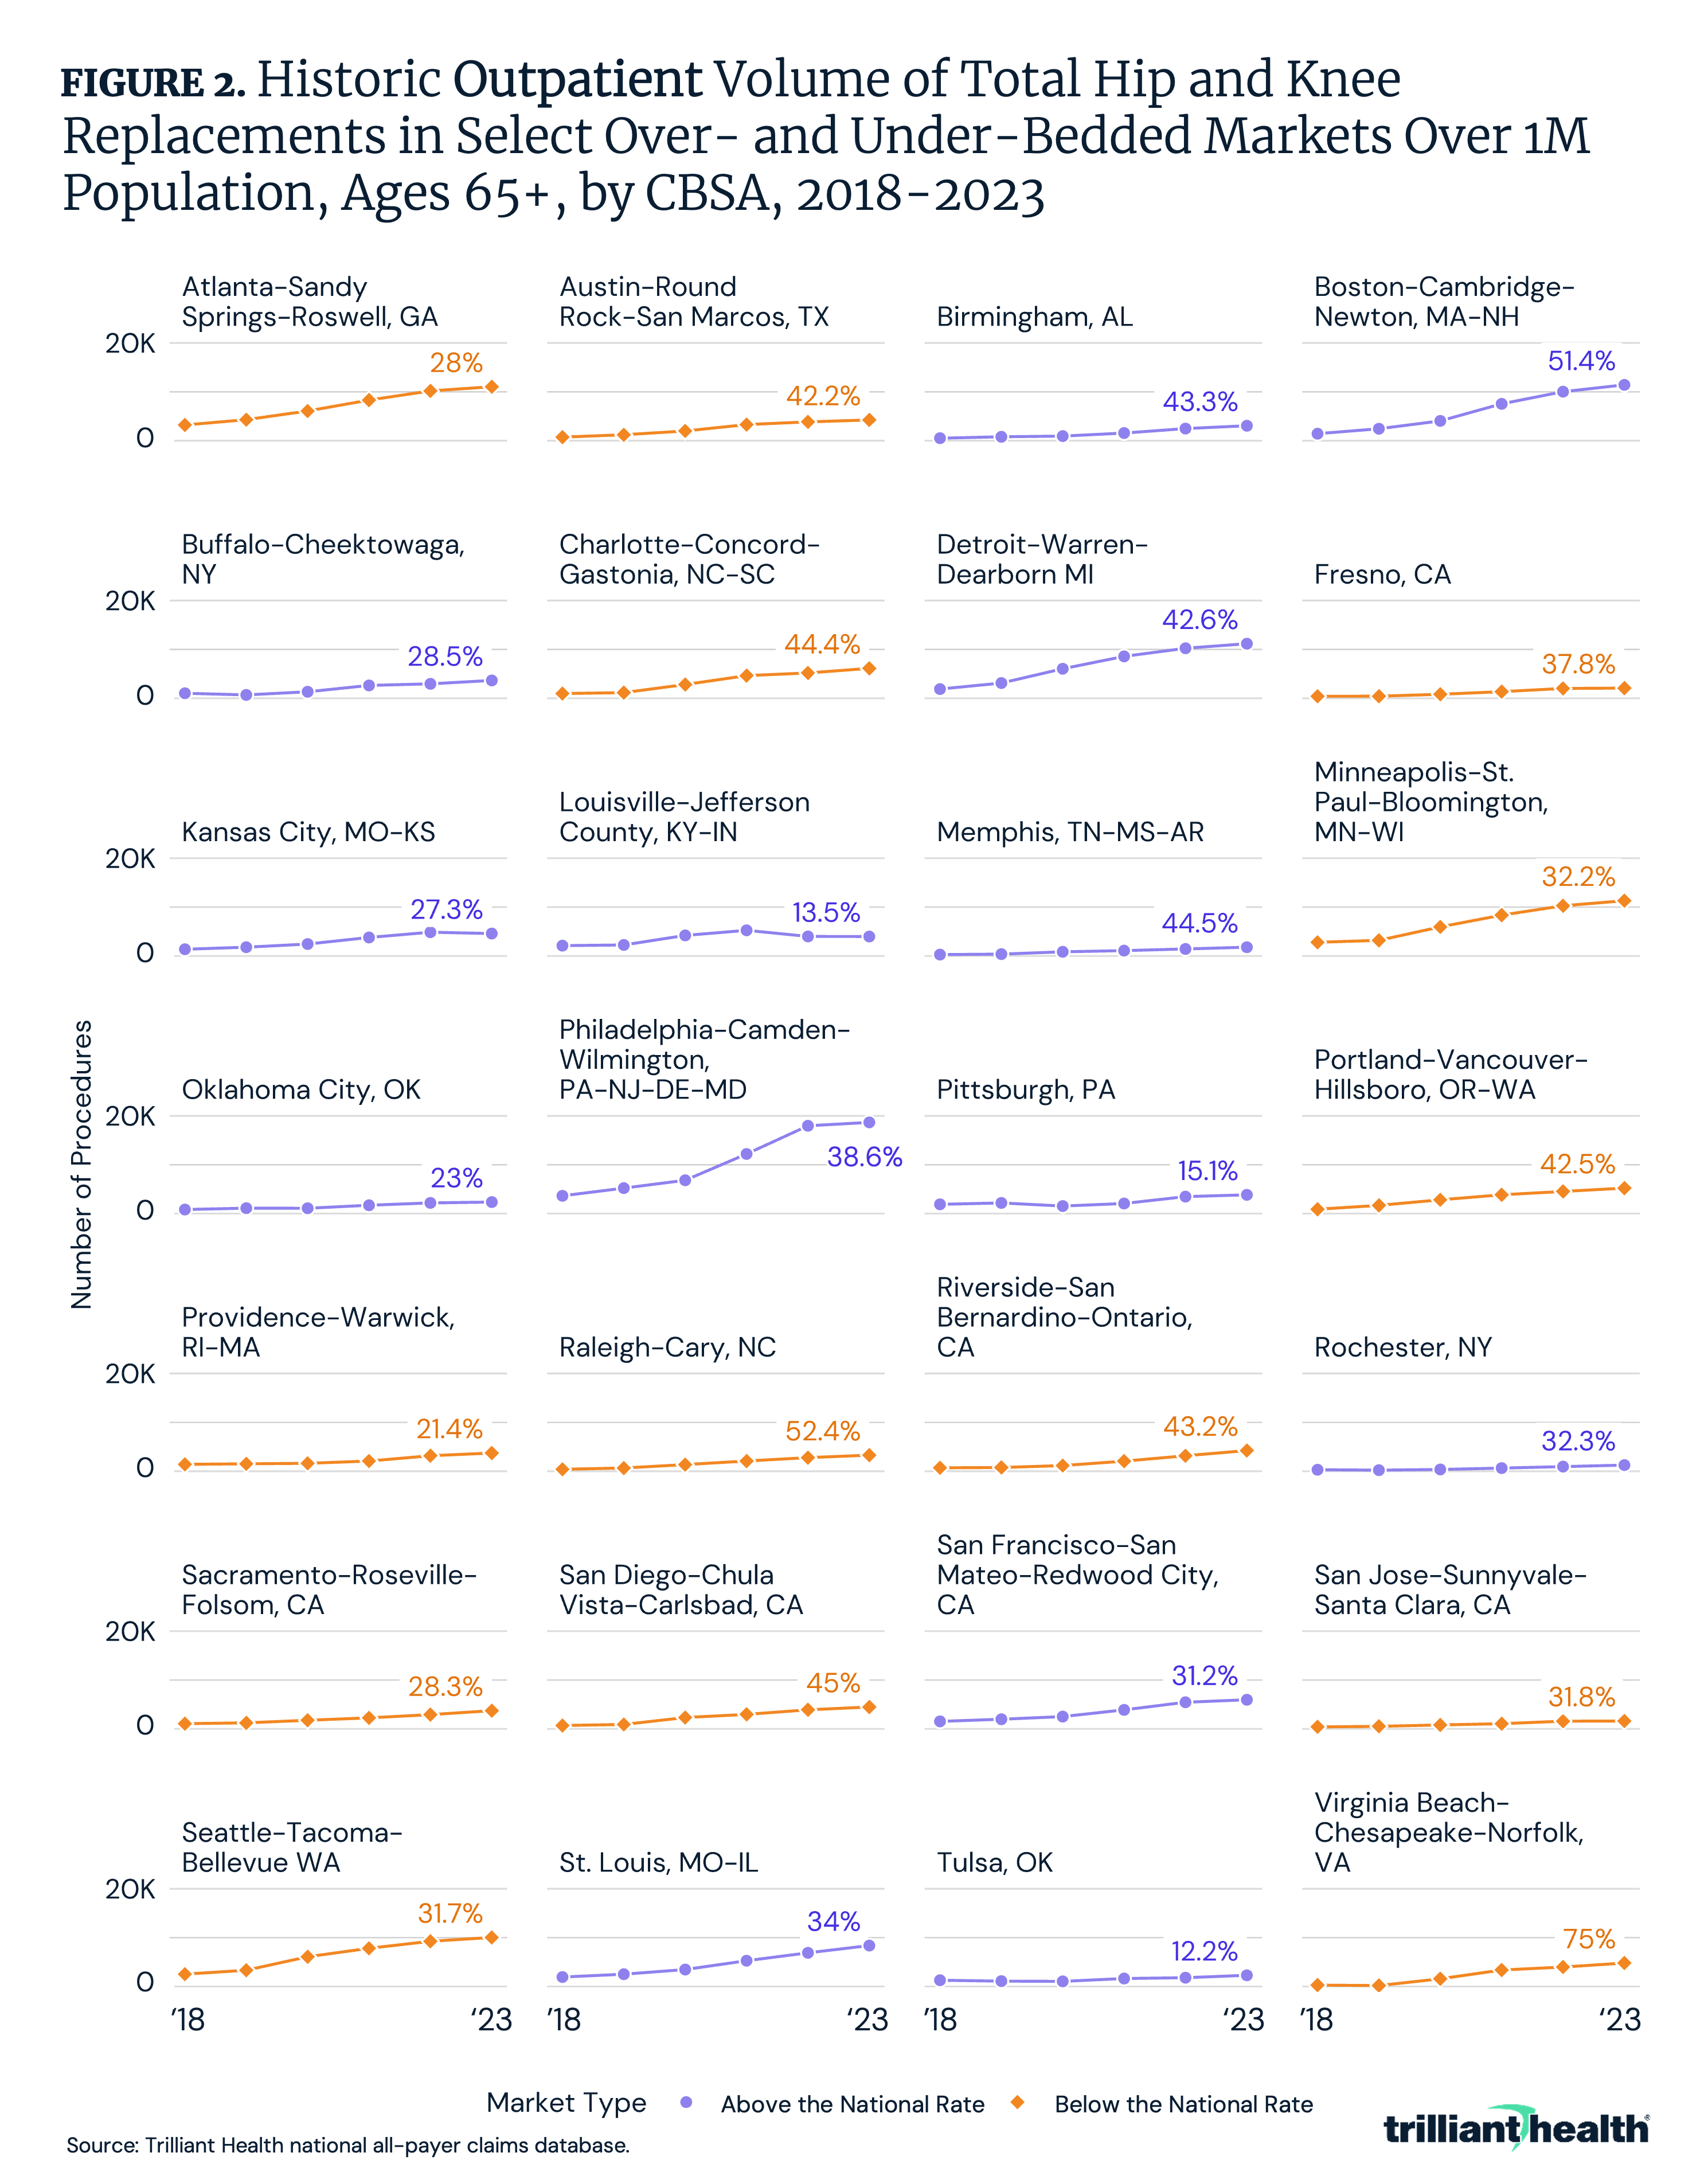
Regarding outpatient procedures, the volume of total hip and knee replacements increased in all analyzed CBSAs, regardless of bed supply. In oversupplied markets, the five-year compound annual growth rate (CAGR) between 2018 and 2023 ranged from 12.2% in Tulsa, OK to 51.4% in Boston-Cambridge-Newton, MA-NH, with a median CAGR of 31.7% (Figure 2). In undersupplied markets, the five-year CAGR between 2018 and 2023 ranged from 21.4% in Providence-Warwick, RI-MA to 75.0% in Virginia Beach-Chesapeake-Norfolk, VA, with a median CAGR of 40.0%. The shift to outpatient was comparatively faster in markets with an undersupply of hospital beds, potentially reflecting the low capacity of inpatient care. How much of the larger magnitude shift in undersupplied markets was driven by a dearth in inpatient capacity vs. patient and provider preferences for outpatient care?
Inpatient demand for total hip and knee replacements for patients ages 65 and older is forecasted to decline in all CBSAs analyzed, regardless of bed oversupply or undersupply, with a five-year CAGR ranging from-7.4% to -5.8% (Figure 3). Among oversupplied markets over 1M population, Tulsa, OK (-5.8% CAGR) and Boston-Cambridge-Newton, MA-NH (-5.9% CAGR) have the lowest forecasted rate of decline, while Buffalo-Cheektowaga, NY (-7.9% CAGR) and Rochester, NY (-7.1% CAGR) have the highest forecasted rate of decline. In undersupplied markets over 1M population, Providence-Warwick, RI-MA (-6.1% CAGR) and Charlotte-Concord-Gastonia, NC-SC (-6.2% CAGR) have the lowest forecasted rate of decline, while Raleigh-Cary, NC (-7.2% CAGR) and Seattle-Tacoma-Bellevue, WA and Atlanta-Sandy Springs-Roswell, GA (-7.1%) have the highest forecasted rate of decline. A similar magnitude of decline across both over- and under-bedded markets suggests that inpatient demand will not outpace inpatient capacity, even in under-bedded areas.
Conclusion
This analysis highlights that markets with a relative undersupply of hospital beds can still meet local demand for high-acuity care because of advances in technology that allow an increasing number of surgical procedures to be performed in ambulatory settings. In turn, this analysis suggests that markets with a relative oversupply of hospital beds have excess capacity that could – or should – be phased out. What should be done in a particular market requires a market-level analysis of demand trends and population-based statistics to understand the “complete picture” of a market.
The widespread growth in outpatient total hip and knee replacements is expected, given broader outpatient surgical trends and the removal of these procedures from Medicare’s inpatient-only list. Notably, the magnitude of that outpatient shift was comparatively higher in “undersupplied” markets, suggesting that those markets are meeting underlying demand by investing in lower-cost capital infrastructure (e.g., an outpatient facility instead of a new hospital tower).
Importantly, several markets – ranging from rural to micropolitan to metropolitan areas – have a true undersupply of hospital beds relative to the existing and future high-acuity and surgical demand. Therefore, policymakers and health economy stakeholders must consider strategies to address these imbalances. Under-bedded regions may need to explore expansions in hospital capacity, innovative care models or increased access to outpatient surgical settings (e.g., reimbursement parity, ambulatory surgery center expansion). Over-bedded markets, on the other hand, should explore ways to optimize or repurpose excess capacity to meet evolving healthcare needs – or eliminate it altogether. Aligning hospital bed capacity with medical and surgical demand based on market-level analysis is essential to bending the cost curve in the health economy, which in turn is essential to sustaining high-value care for an aging population. Future research should continue to monitor how hospital infrastructure impacts both the quality and efficiency of care delivery in high-demand surgical settings.
Get the latest insights delivered to your inbox.
Related Research
Was this shared with you?
Subscribe for weekly insights.
Subscribe to receive weekly insights from Trilliant Health's Research Team
Interested in citing our research? Please follow this guide.
