The Compass
Sanjula Jain, Ph.D. | February 26, 2023Practice Size, Geography, and Patient Panels Will Influence Enhancing Oncology Model Participant Performance
Key Takeaways
-
The high cost of cancer treatment makes it a compelling opportunity for value-based payment models, as evidenced by CMS’s operation of the Oncology Care Model from 2016 to 2022 and upcoming launch of the Enhancing Oncology Model (EOM) in summer of 2023.
-
Depending on the actual costs, which are influenced by practice characteristics, incurred during an EOM performance period, the performance-based payment that a given practice will receive—or owe—varies substantially.
While the past 20 years have brought tremendous progress in cancer outcomes, cancer continues to be a significant driver of rising national health care costs. Annual costs for cancer-related services and drugs are projected to reach nearly $246B nationally in 2030, representing a 34% increase since 2015.1 The high cost of cancer treatment makes it a compelling opportunity for value-based payment models, as evidenced by CMS’s operation of the Oncology Care Model (OCM) from 2016 to 2022 and introduction of the Enhancing Oncology Model (EOM) in summer of 2023.
Background
While the number of value-based care (VBC) programs continues to grow, results tend to be mixed, with no consensus on program effectiveness.2,3 It is often difficult to evaluate these programs as almost all VBC initiatives are voluntary, and participants who opt in are more likely to be successful. Aspects of EOM reflect CMS’s attempt to remedy certain OCM issues, such as EOM’s focus on more common cancer types, expanded data reporting requirements, reduced monthly enhanced oncology services payments, and first-day downside risk requirements.4,5 However, the 81-page EOM payment methodology document gives practices little insight into the financial and care quality expectations ahead of program initiation.6,7 With 100% of the risk held by the EOM participant, rather than shared with CMS, estimation of potential performance outcomes is imperative.
Analytic Approach
To better understand the range of performance outcomes for hypothetical participants, we leveraged our publicly available EOM Performance Estimator to project benchmark costs and financial outcomes for differently sized practices. We held constant region (Northeast), population density (urban), and the distribution of cancer types (i.e., 20% breast cancer, 10% chronic leukemia, 20% lung cancer, 15% lymphoma, 15% multiple myeloma, 10% prostate cancer and 10% colorectal cancer). Based on distribution of observed practice panels, we define the “small” practice to have 20 patients, the “average” practice to have 100 patients, and the “large” practice to have 500 patients. For illustrative purposes, we assigned each practice an Aggregate Quality Score of 70.
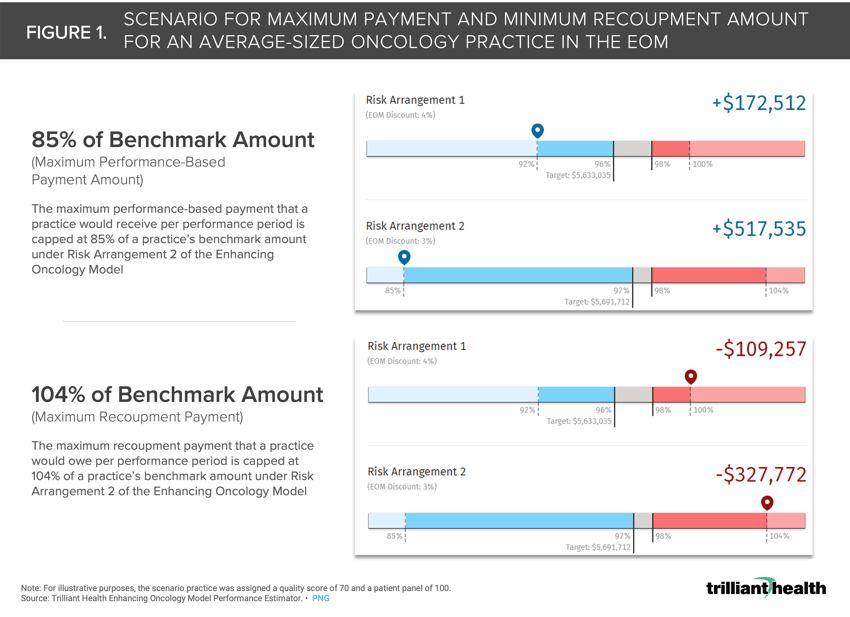
Prospective participants must choose between two risk arrangements (RA): RA1 and RA2 (Figure 1). For each RA, the target amount is calculated as the practice’s benchmark amount multiplied by the EOM discount. The target amount and 98% recoupment threshold are compared to the actual cost selected by the user to determine the practice's cost savings or excess. This amount or the relevant stop-gain/stop-loss amount is then multiplied by the Aggregate Quality Score performance multiplier and adjusted for sequestration. The stop-gain threshold is 85% of the benchmark amount under RA2 (+$517,535 for the average practice in this scenario), while the stop-loss threshold is 104% of the benchmark amount under RA 2 (-$327,772 for the average practice in this scenario).
Findings
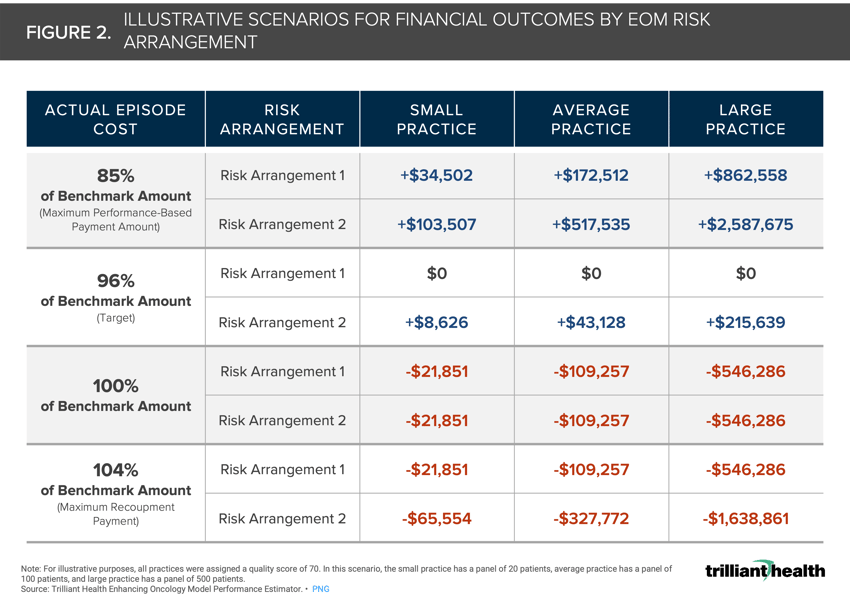
Depending on the actual costs incurred during an EOM performance period, the performance-based payment that a practice could receive, or recoupment payment owed, can vary substantially. The range for the large practice in this scenario is a gain of $2.6M or a loss of $1.6M; for the small practice, a gain of $103.5K or a loss of $65.5K; for the average practice, a gain of $517.5K or a loss of $327.8K (Figure 2).
The lack of collaborative, shared risk coupled with reduced monthly payments creates a significant financial burden on practices, which will need to invest in and implement care management services and IT/administrative systems prior to receiving any funds. Additionally, practices must increase financial reserves, both to support the increased costs and to protect themselves from downside risk. Smaller, independent practices are limited in their ability to provide upfront financial resources and thus are less likely to participate – and these groups are likely those that need a VBC approach the most. The limited scope of EOM and increased financial burden create significant headwinds for this program and participation could be significantly less than for OCM, which would further limit the ability of EOM to be effective.
Thanks to Kris Enloe, Yelena Goryunova, Katie Patton and Cindy Revol for their research support.
- Specialty Care
- Cost of Care
- Medicare & Medicaid
You are currently viewing a free preview of our premium studies. To receive new studies weekly, upgrade to Compass+ Professional.
Sign UpSee more with Compass+
You are currently viewing the free version of this study. To access the full study, subscribe to Compass+ Professional for $199 per year.
Sign Up for Compass+
