The Compass
Sanjula Jain, Ph.D. | May 19, 2024Oral Contraceptive Prescription Use is Rising but Varies by Age and Region
Key Takeaways
-
The landscape of oral contraceptive use in the U.S is influenced by a combination of enhanced access, regulatory changes, regional variation and societal factors. These dynamics underscore the importance of continuing efforts to improve contraceptive accessibility and address disparities in women's healthcare across different regions and age groups.
-
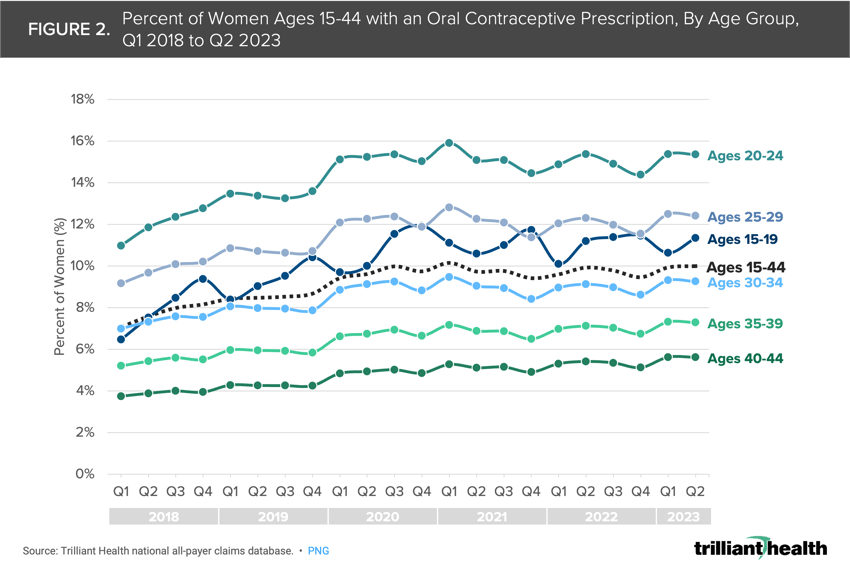
Between Q1 2018 and Q2 2023, the share of women ages 15 to 44 with oral contraceptive prescriptions increased from 7.1% to 10.0%, with the highest usage among women ages 20 to 24 (15.4% in Q2 2023) and the lowest among those ages 40 to 44 (5.6% in Q2 2023).
-
Compass+ Exclusive:
-
Factors Driving Oral Contraceptive Demand
-
Contraceptive Prescribing Trends by Provider Type
-
You are currently viewing the public version of The Compass.
To unlock additional analyses, upgrade your subscription to the Compass+ Portal.
National Women’s Health Week, observed annually beginning on Mother’s Day, aims to highlight women’s health priorities and encourage women to prioritize their physical, mental and emotional wellbeing.1 In recent years, both private and public investments in women’s health research and initiatives have increased significantly, with venture capital investments in women’s health companies rising by 314% in the first half of 2023 compared to 2018.2 Legal challenges regarding reproductive care in recent years have affected access and have also spurred greater funding and accelerated women’s health research.3 Given these notable shifts in the reproductive care landscape – amid the declining U.S. birth rate – we sought to analyze national prescribing patterns of oral contraceptives.
Background
The ACA, enacted in 2010, increased accessibility and affordability of contraceptives by mandating coverage without cost sharing. While annual OB/GYN or primary care provider visits were previously required for contraceptive access, 29 states now allow pharmacists to prescribe contraceptives, and direct-to-consumer (DTC) companies like Nurx and Hims & Hers provide expanded access to contraception.4 Additionally, in 2023, the first oral contraceptive was approved for over-the-counter (OTC) use in the U.S. and became available for purchase in early 2024.5 However, there is a growing trend of contraception misinformation on social media platforms, potentially leading to changes in contraceptive methods or discontinuation.6 This underscores the growing trust in non-medical sources of health information on social media platforms in particular.7 Recent research also indicates a sudden increase in rates of permanent contraception procedures (i.e., tubal sterilization and vasectomy) among patients ages 18 to 30 in 2022 and 2023.8
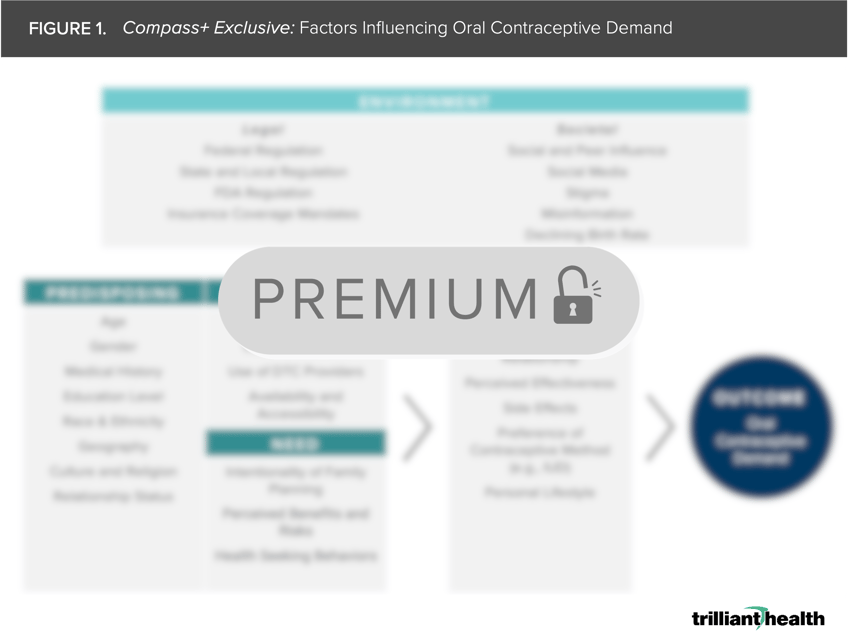
While access to contraceptives – both oral and implantable – has steadily increased throughout the 21st century, the factors influencing oral contraceptive demand are dynamic, and thus we wanted to understand the extent to which contraceptive utilization has changed in recent years (Figure 1).

Analytic Approach
Utilizing our national all-payer claims database, we analyzed rates of oral contraception prescribing among women ages 15 to 44 between Q1 2018 and Q2 2023 nationally and by state. We analyzed patients with at least four medical visits between 2017 and 2023. We also leveraged our Provider Directory to examine the share of prescriptions by healthcare provider type (i.e., primary care physician (PCP), OB/GYN, allied health) and to characterize patient interactions with providers prior to receiving oral contraceptive prescriptions.
Findings
Among women ages 15 to 44, the share with an oral contraceptive prescription increased from 7.1% in Q1 2018 to 10.0% in Q2 2023 (Figure 2). Further age segmentation reveals women ages 40 to 44 have the lowest share of oral contraceptive prescriptions (5.6% in Q2 2023), while women ages 20 to 24 represent the highest share (15.4% in Q2 2023).

While contraceptive use has increased nationally over time, the share of women ages 15 to 44 prescribed oral contraceptives varies by state. As of Q2 2023, the share of women with an oral contraceptive prescription is highest in Hawaii (15.7%) and lowest in New Mexico (7.3%) (Figure 3). To what extent could these differences be due to broad or limited access? Or to patient preferences?
We also analyzed the average share of women prescribed oral contraceptives for the four quarters preceding and following the Supreme Court’s decision in Dobbs v. Jackson Women’s Health Organization, which ended the constitutional right to an abortion, and compared the percentage point difference in those average rates. As of May 2024, there are 21 states with active abortion bans or have restricted the procedure earlier in pregnancy than the standard set by Roe v. Wade. The bans previously issued in Iowa, Montana and Wyoming have been temporarily blocked. Among those 24 states, only ten states saw an increase in average utilization rate and the other 14 states saw the proportion of women prescribed oral contraceptives decline between those two time periods (Figure 4).
Compass+ Exclusive: Contraceptive Prescribing Trends by Provider Type
Unlock the complete analysis with Compass+
Conclusion
Amidst increasing investments in women's health and significant legal and societal shifts in reproductive care, the trends and patterns of contraceptive utilization across age groups and regions impact numerous health economy stakeholders. Recent investment activity suggests recognition of pent-up market demand for the coverage and provision of women’s health services, but the dynamics between private equity, new women’s health entrants, legacy OB/GYN providers and health systems are complicated, given competing motivations. Regardless, stakeholders must remain focused on improving outcomes, increasing access and ensuring affordability.
Our research also highlights the impact of recent regulatory changes, such as the approval of OTC oral contraceptives and expanded prescribing authority for pharmacists. Despite efforts to increase access points, most patients still prefer to seek contraceptive care with PCPs or OB/GYNs (“traditional providers”), as opposed to DTC providers. This trend is consistent with our previous research about the nominal market impact and reach of new entrants. Additionally, it will be important for providers to monitor and understand patient decision-making motivations for discontinuing contraceptives, as patient trust in social media for health information – and often misinformation – grows.
Moving forward, these findings can help further optimize contraceptive access and utilization, particularly among underserved populations, regions with lower prescribing rates and regions with broader restrictions on reproductive care. As we commemorate National Women’s Health Week, it is imperative for health economy stakeholders to consider the complex interplay of social, economic and policy factors influencing not only contraceptive access, but women’s health overall.
To learn more, please see a recent article from New York Times that featured our study findings.
Thanks to Austin Miller, Alli Oakes and Katie Patton for their research support.
- Women's Health
- Social Determinants of Health
- Healthcare Workforce
You are currently viewing a free preview of our premium studies. To receive new studies weekly, upgrade to Compass+ Professional.
Sign UpSee more with Compass+
You are currently viewing the free version of this study. To access the full study, subscribe to Compass+ Professional for $199 per year.
Sign Up for Compass+

