.png)


.png?width=171&height=239&name=2025%20Trends%20Report%20Nav%20(1).png)


The 2024 Trends Shaping the Health Economy Report offers a data-driven national analysis of eight macro trends that define the health economy. In the coming weeks, we will explore these trends in more depth, examining how all trends are interconnected. This week, we examine the eight trends in aggregate.
Previous report editions concluded that:
- Healthcare is a negative-sum game;
- Every part of the health economy – from payers and providers to life sciences and new entrants — will be impacted by reduced yield; and
- The winners in healthcare’s negative-sum game will be those who deliver value for money.
The 2024 health economy trends reveal the importance of optimizing value, as opposed to maximizing value. Below, we explore key takeaways from each trend, which taken together reveal that health economy stakeholders who shift their focus from value maximization for themselves to value optimization for their customers will gain a significant competitive advantage.
Update: read about the latest trends in the 2025 edition of our annual report series.
Trend 1: The Current Healthcare System Does Not Promote Health and Is Disproportionately Expensive
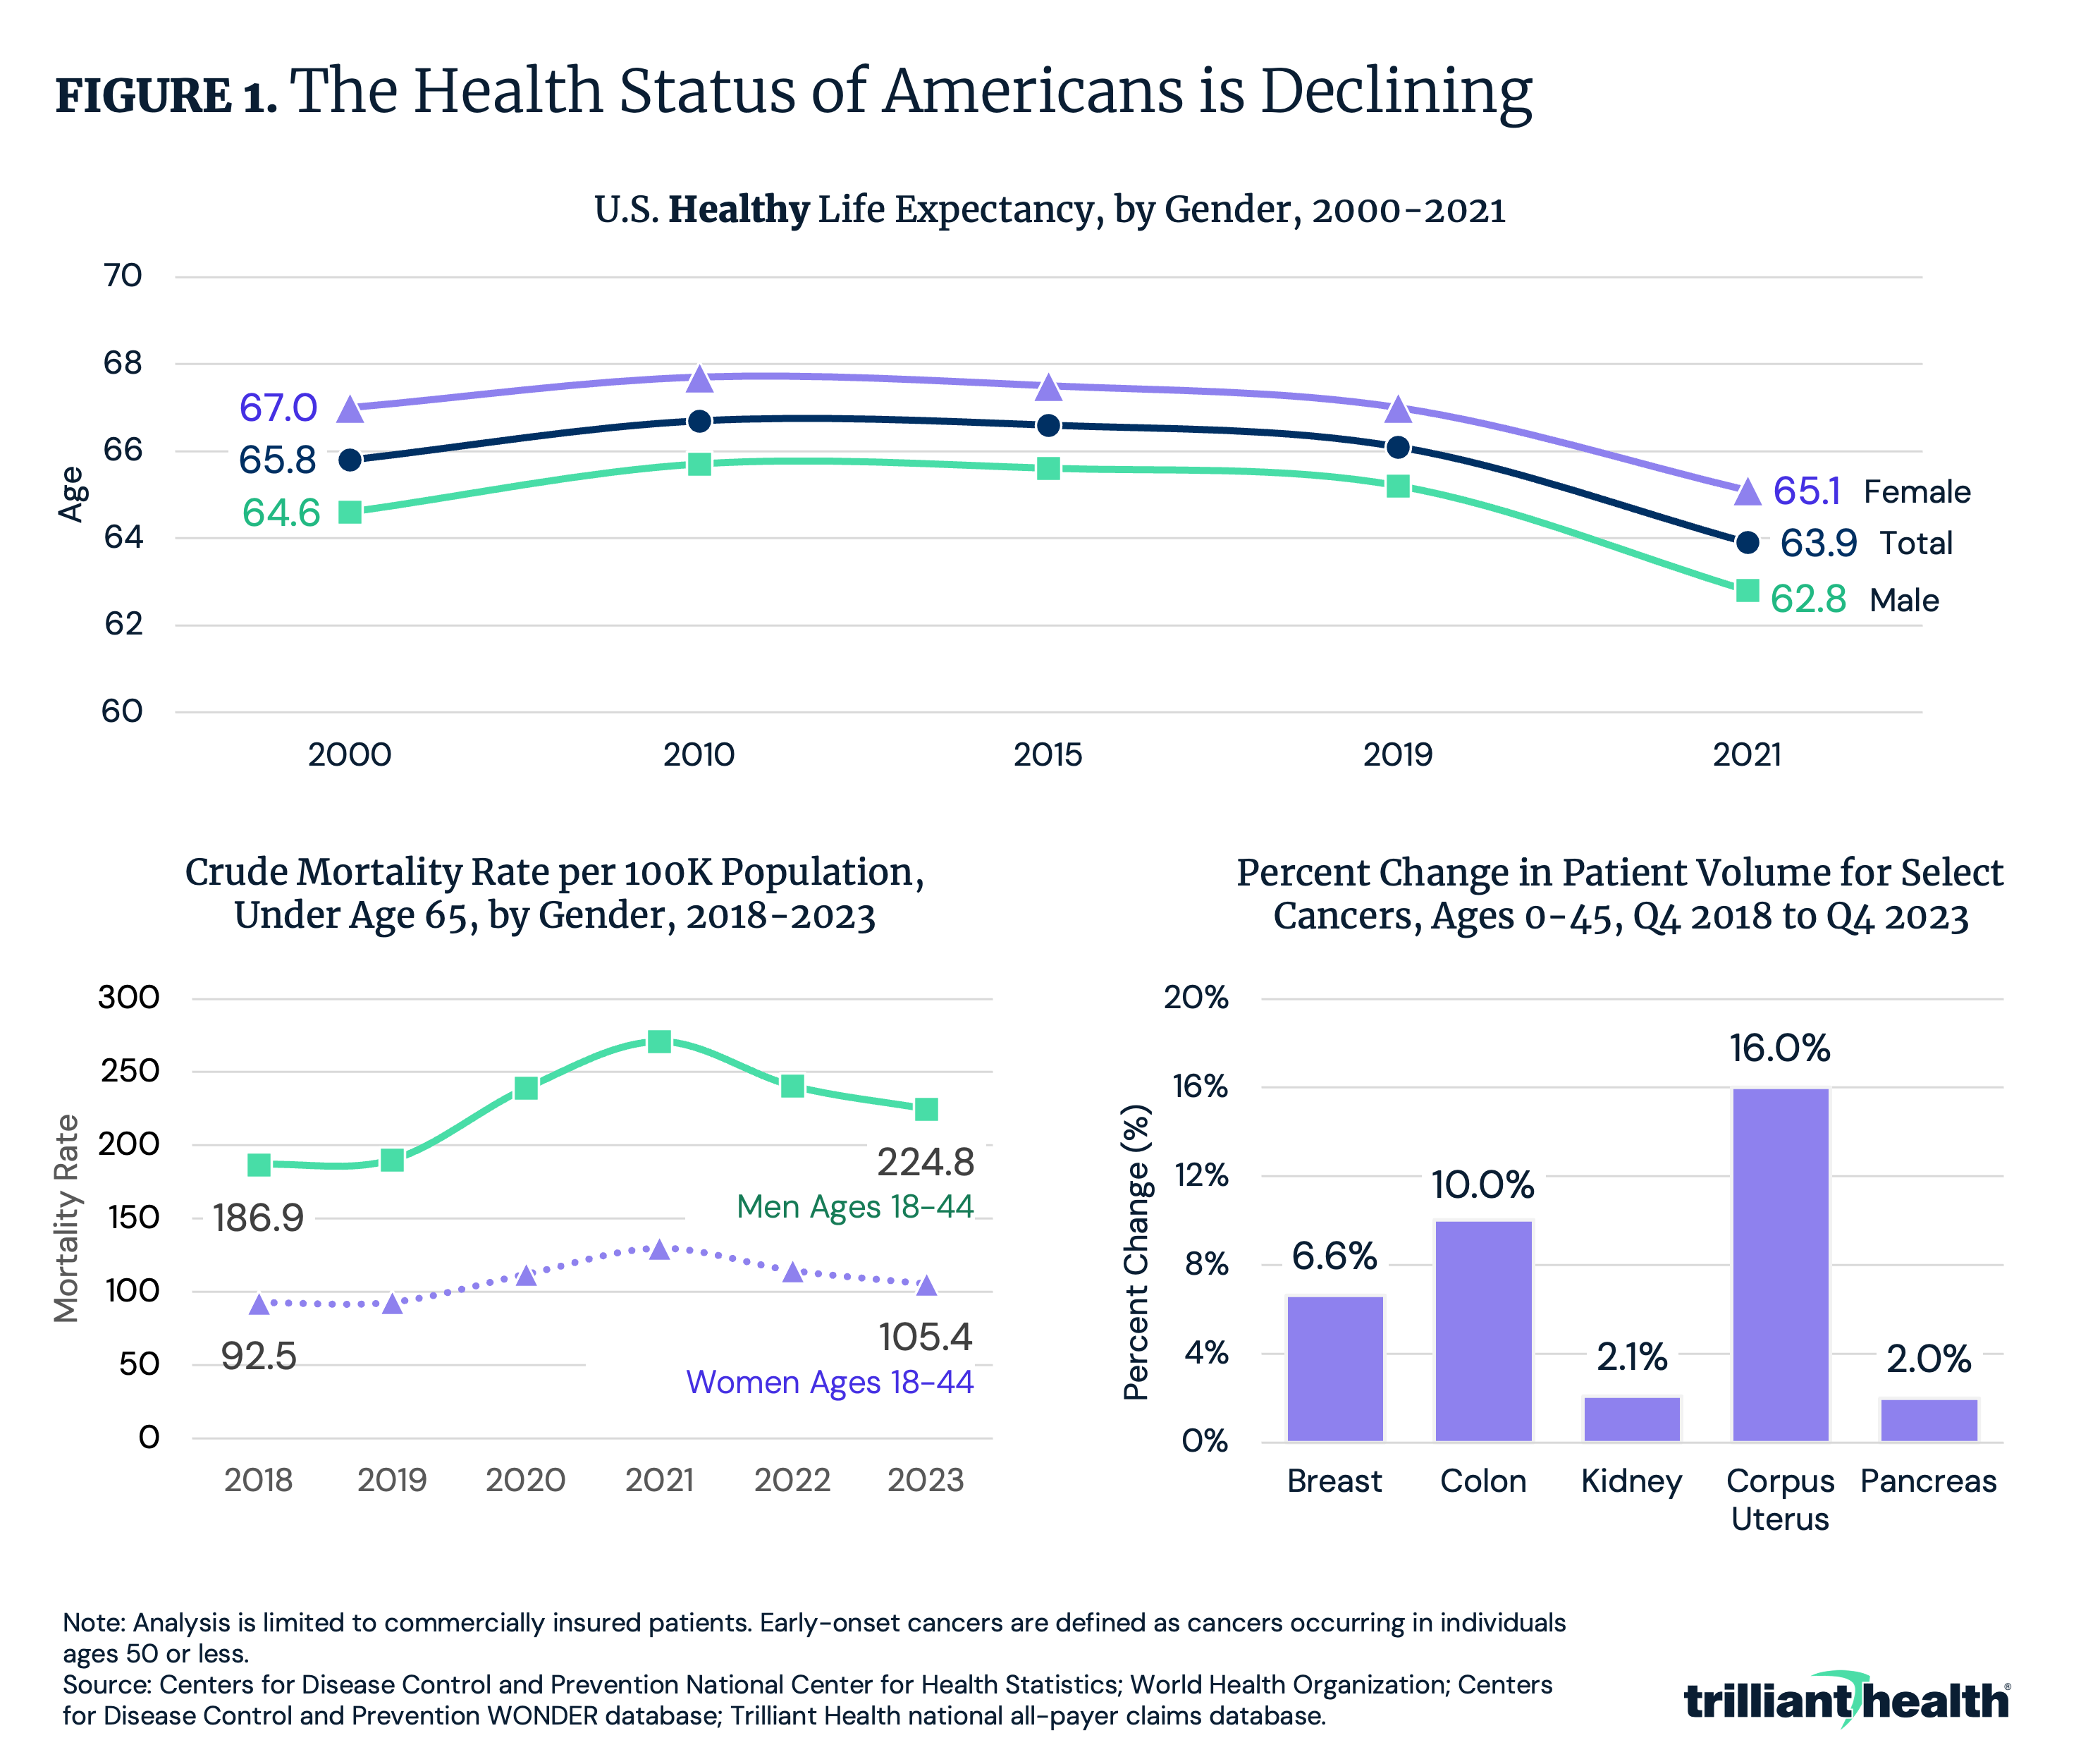
Every stakeholder must acknowledge that the inputs of the U.S. healthcare system, as measured by cost, exceed the outputs, as measured by the actual value or benefits received. Healthcare spending has increased by 59.3% since 2000, with national health expenditures (NHE) totaling $4.5T in 2022 and projected to reach $7.7T by 2032. Despite this spending, the health status of many Americans is deteriorating, as demonstrated by declining healthy life expectancy, increasing mortality among younger populations and increases in early-onset cancers. Healthy life expectancy – the average number of years a person can expect to live in “full health” – remained relatively flat from 2000 to 2019, with a decline in 2021 amid the COVID-19 pandemic (Figure 1). Meanwhile, mortality rates for women and men ages 18 to 44 rose and the volume of cancer patients ages 45 and younger increased for select cancers between Q4 2018 and Q4 2023.
Trend 2: Healthcare Utilization Patterns Suggest Health Status Will Continue To Decline
The types and places of care that Americans seek signal further erosion of the health status of Americans. From 2019 to 2023, primary care volume declined by 12.0%, while behavioral health volume increased by 39.8% (Figure 2). The reduction in preventive care, compounded by the increase in behavioral health demand and constrained provider supply will likely result in greater morbidity and mortality. This trend is already materializing for certain conditions, such as chronic liver disease. Since 2018, liver disease and cirrhosis mortality has generally increased, up 63.5% for men ages 18-39, compared to 8.5% for men ages 40-64.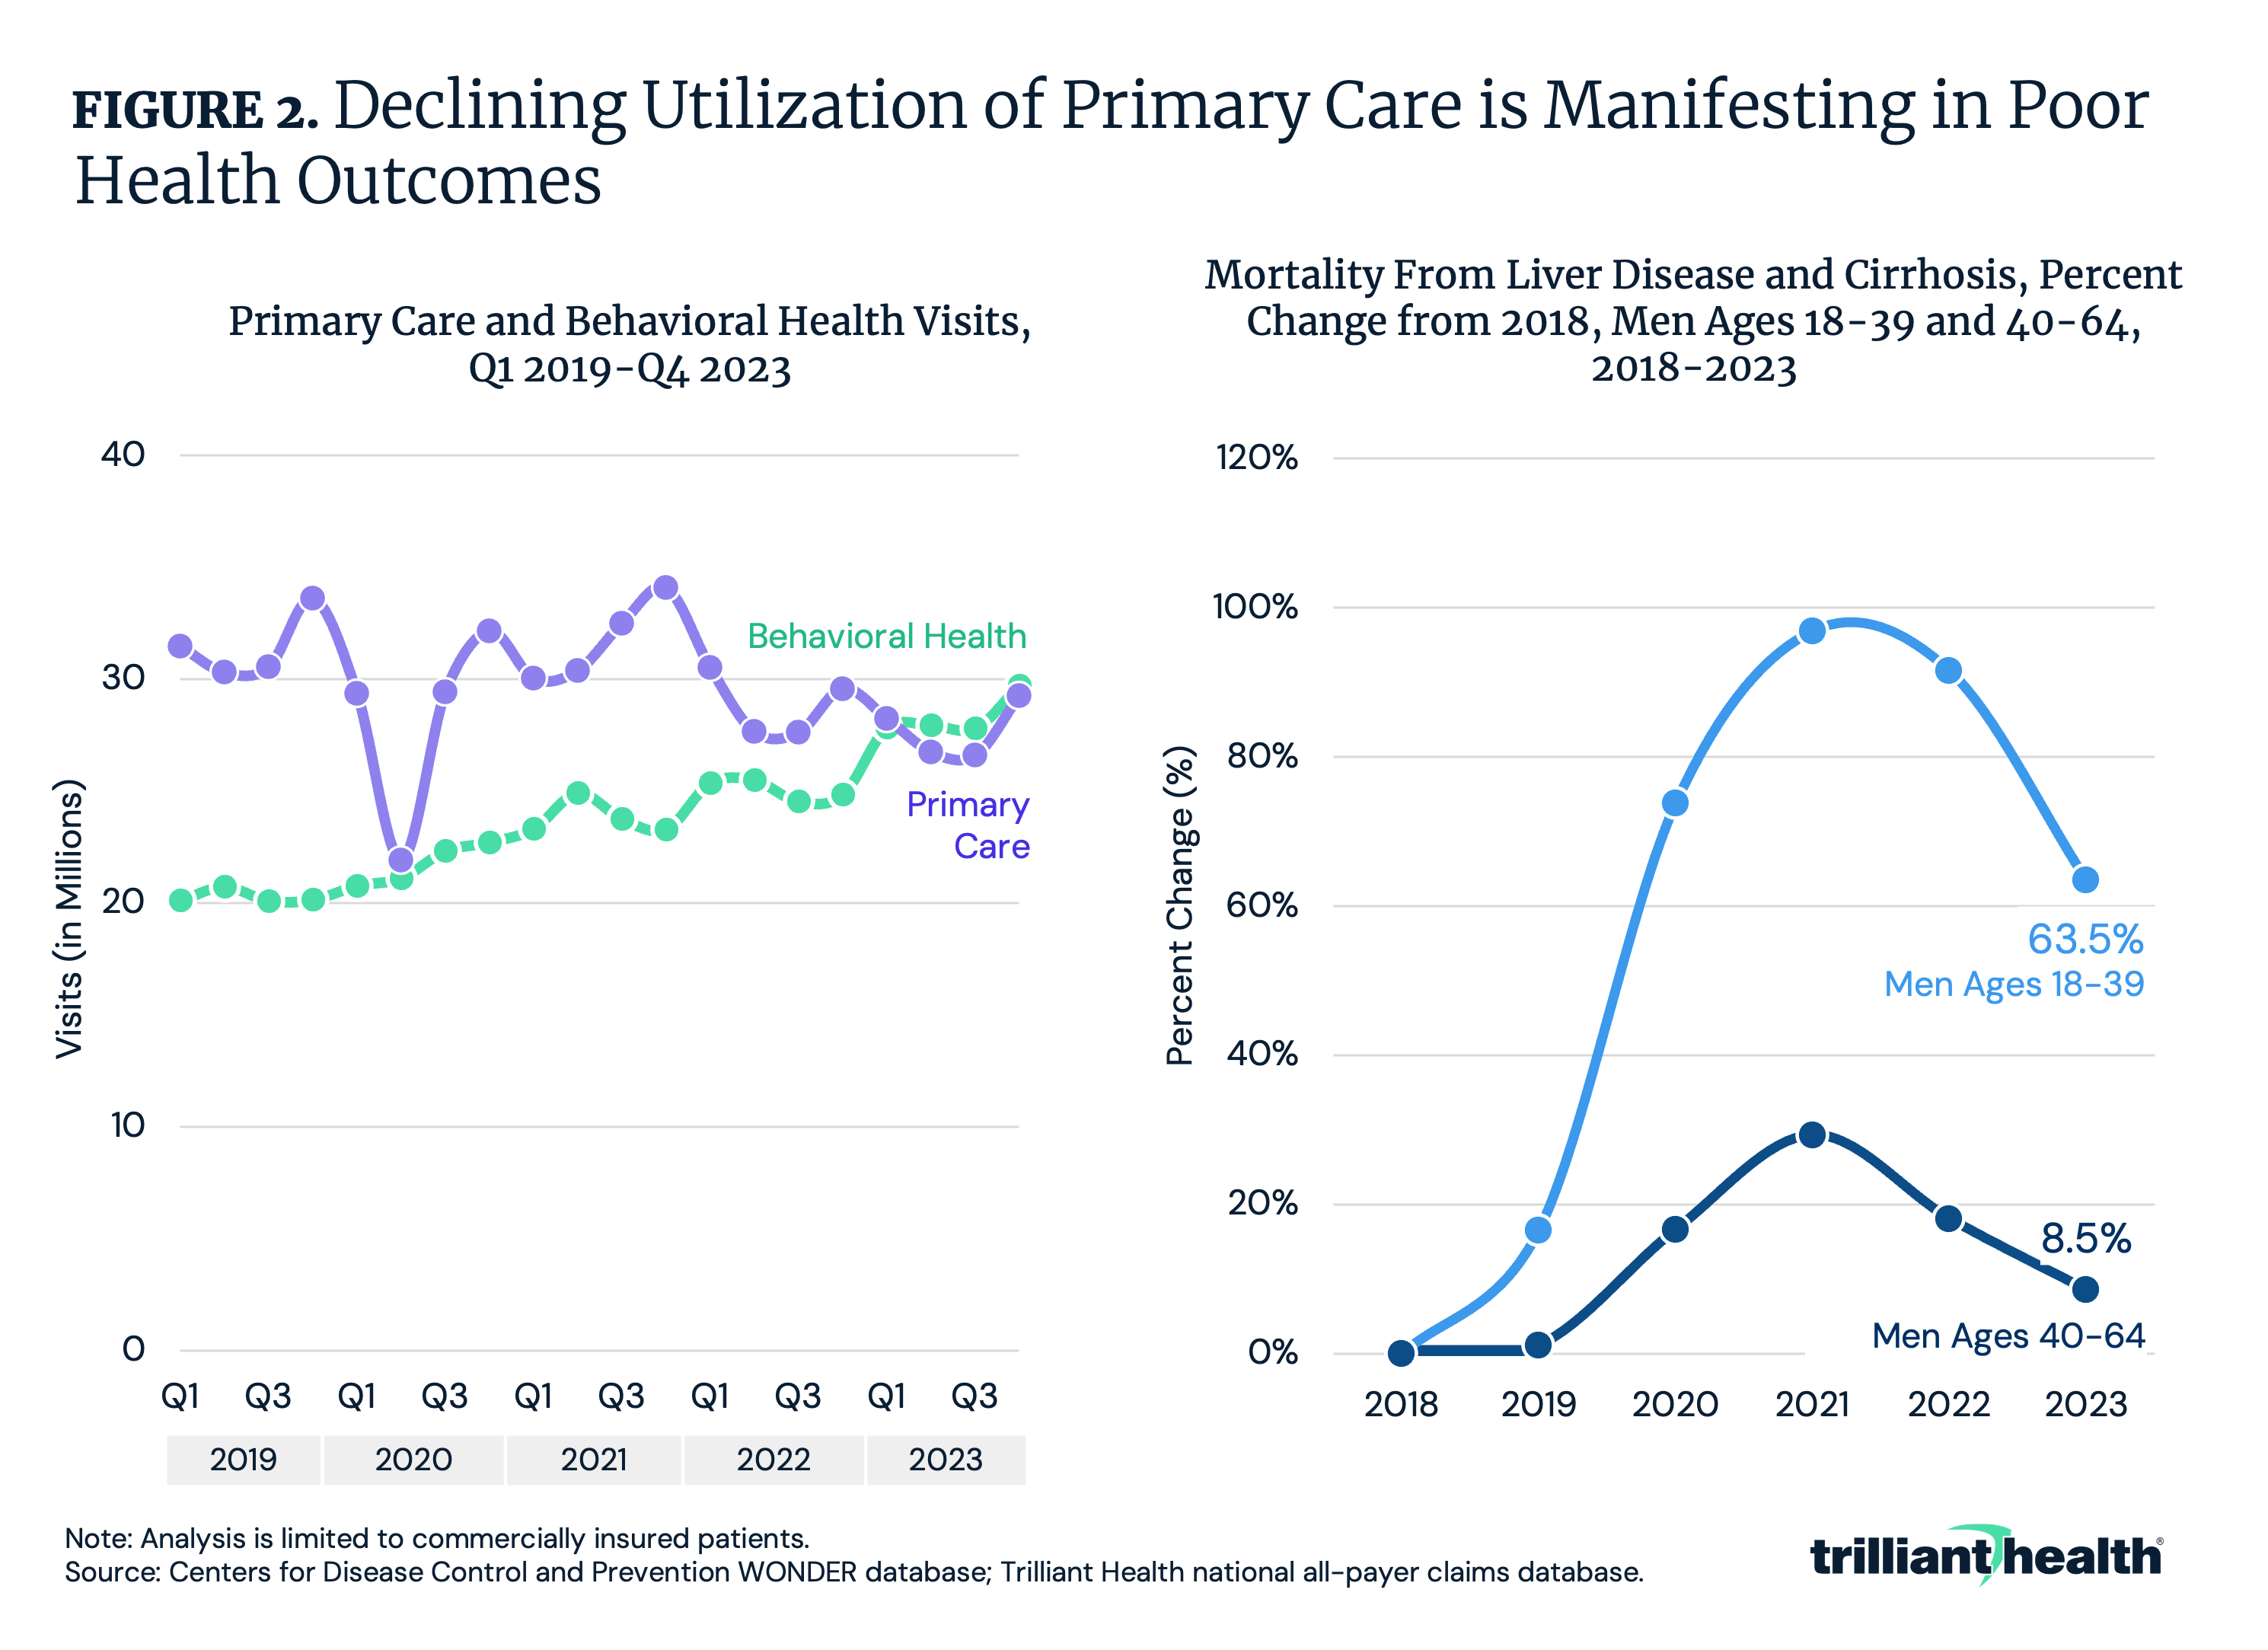
Trend 3: Government Innovation and Regulation Are Failing To Produce Value
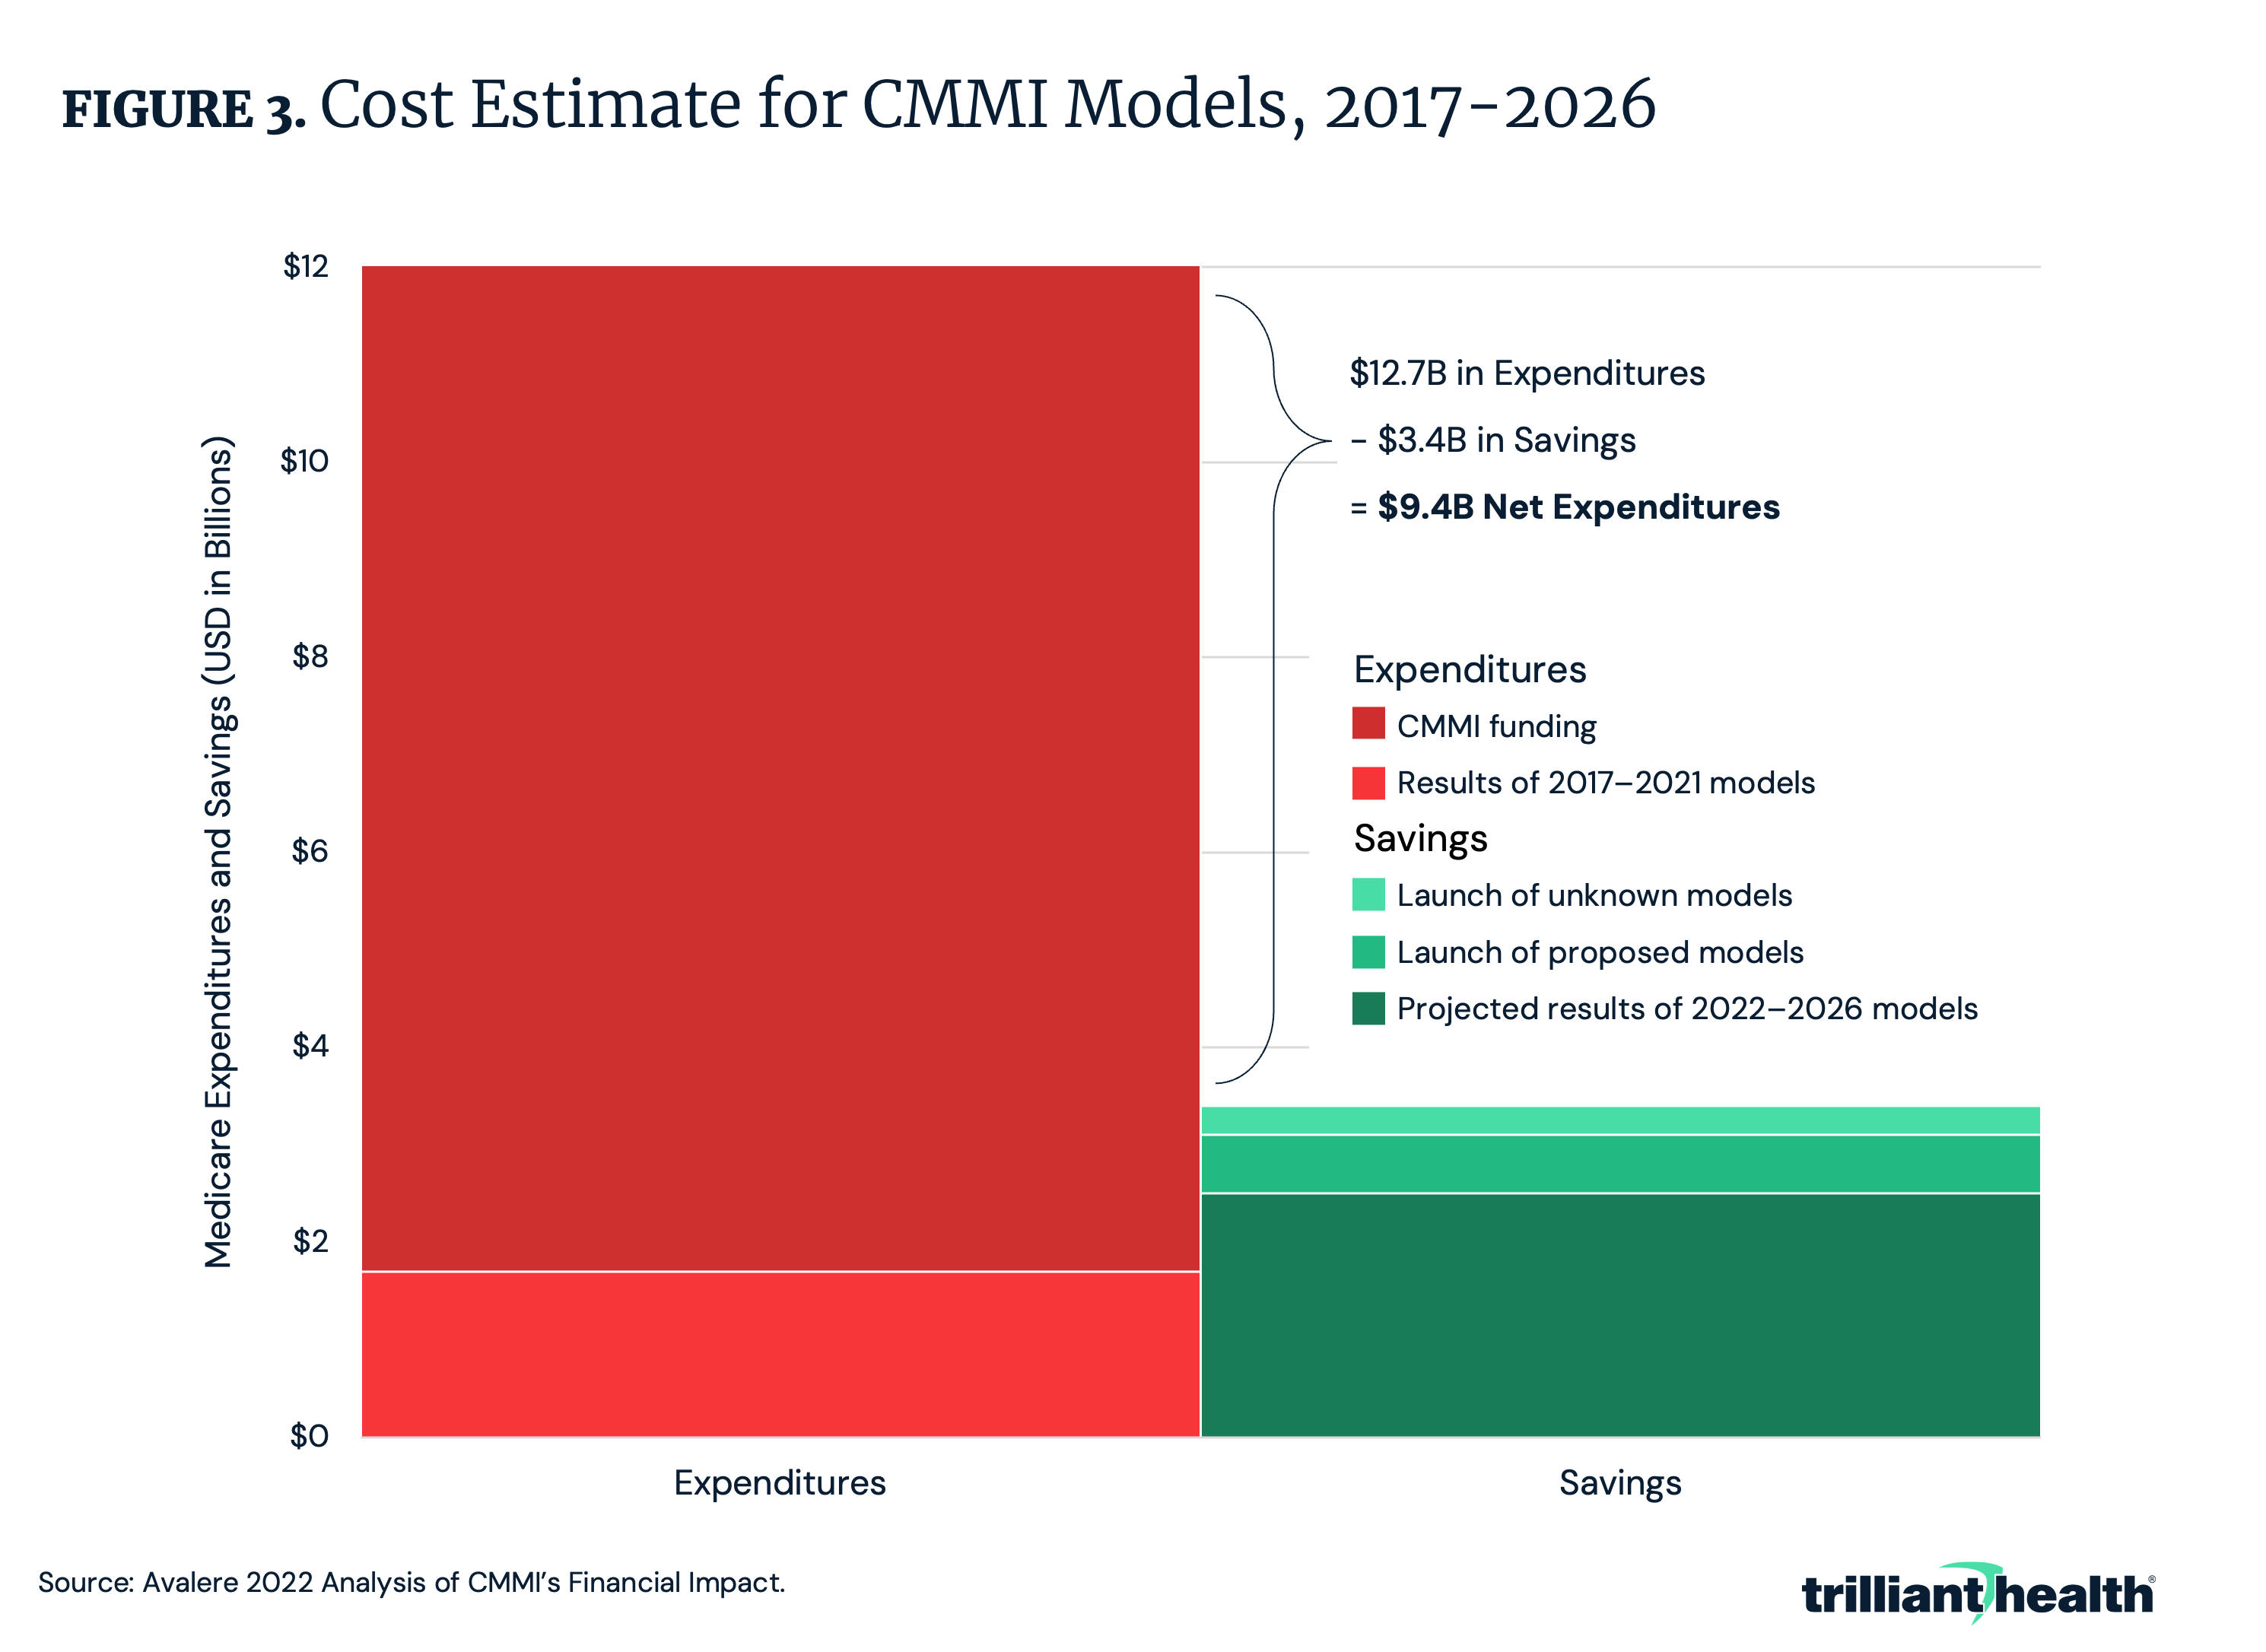
Years of experimenting with quality reporting, implementing value-based payment models, improving healthcare data interoperability and addressing healthcare antitrust has not generated value. For example, Federal efforts to implement value-based payment models over the past 13 years are projected to increase net Medicare spending by $9.4B by 2026 (Figure 3).
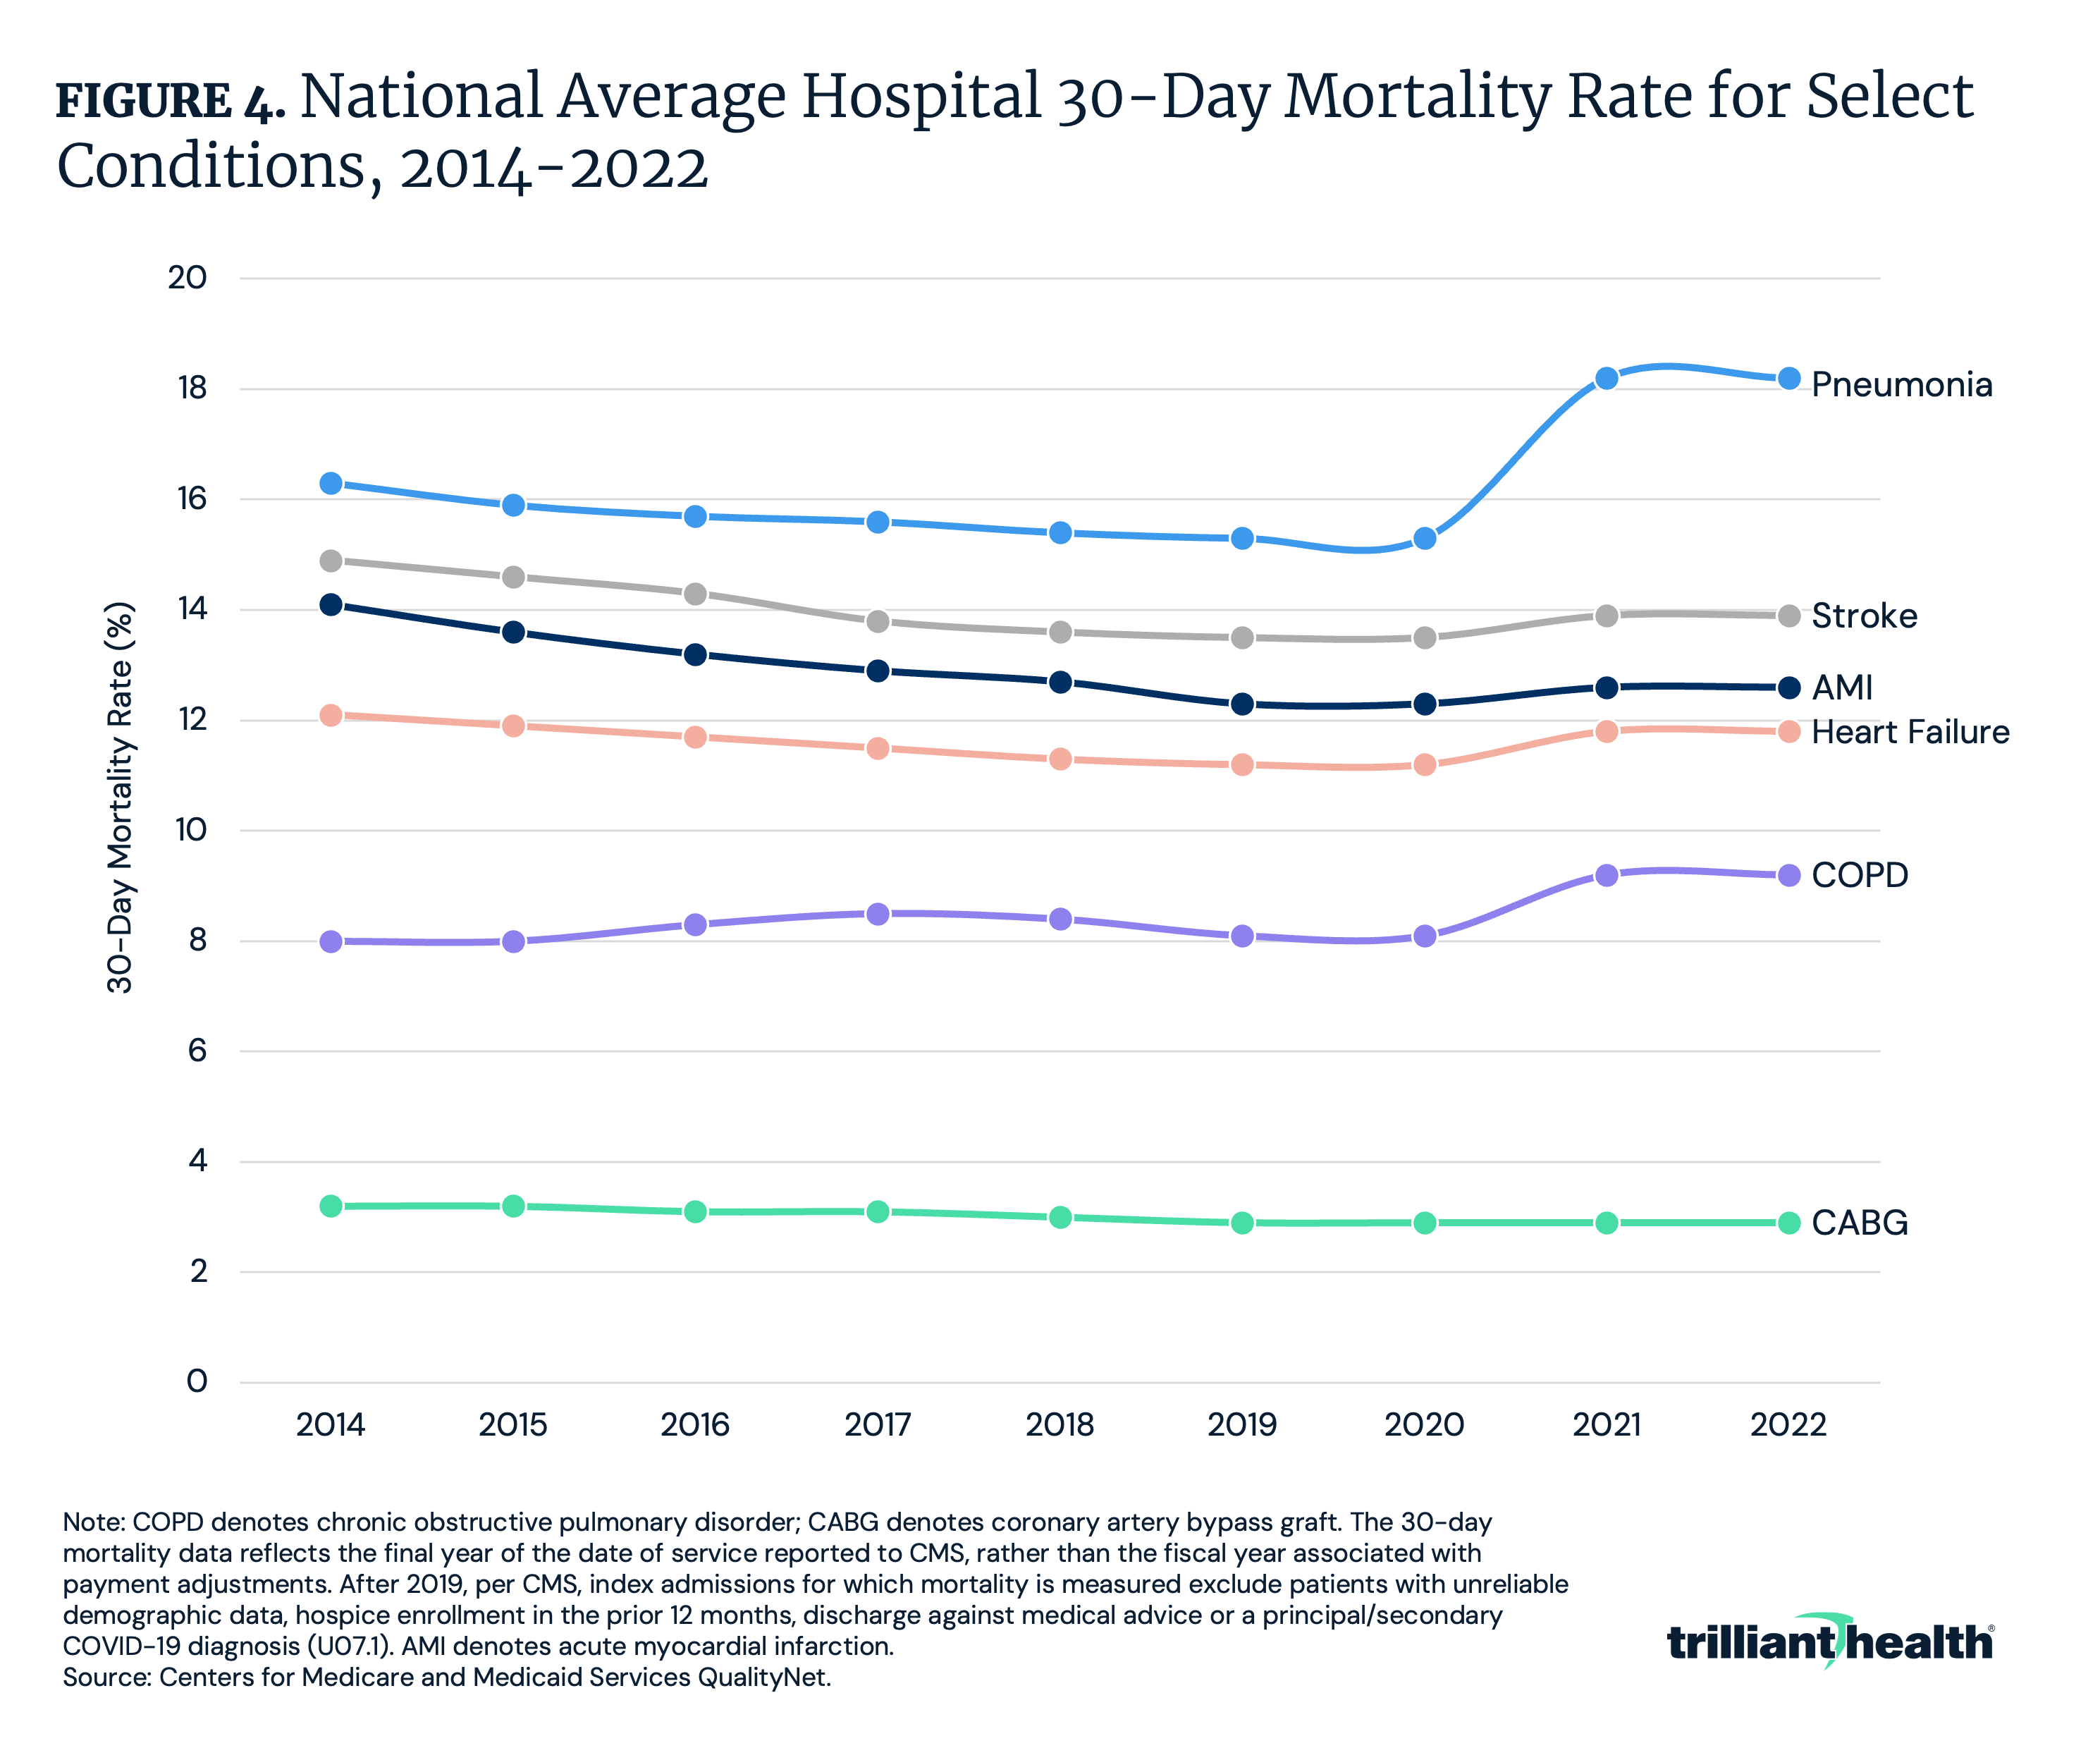
Moreover, average hospital 30-day mortality rates – excluding COVID-19 – increased in 2021 for every condition-specific measure except acute myocardial infarction after years of gradual improvement. Notably, post-discharge mortality for pneumonia (+1.9 percentage points) and chronic obstructive pulmonary disease (COPD) (+1.2 percentage points) increased from 2020 to 2021 and persisted in 2022 (Figure 4).
Trend 4: The Value of Technological Advancements Is Uncertain
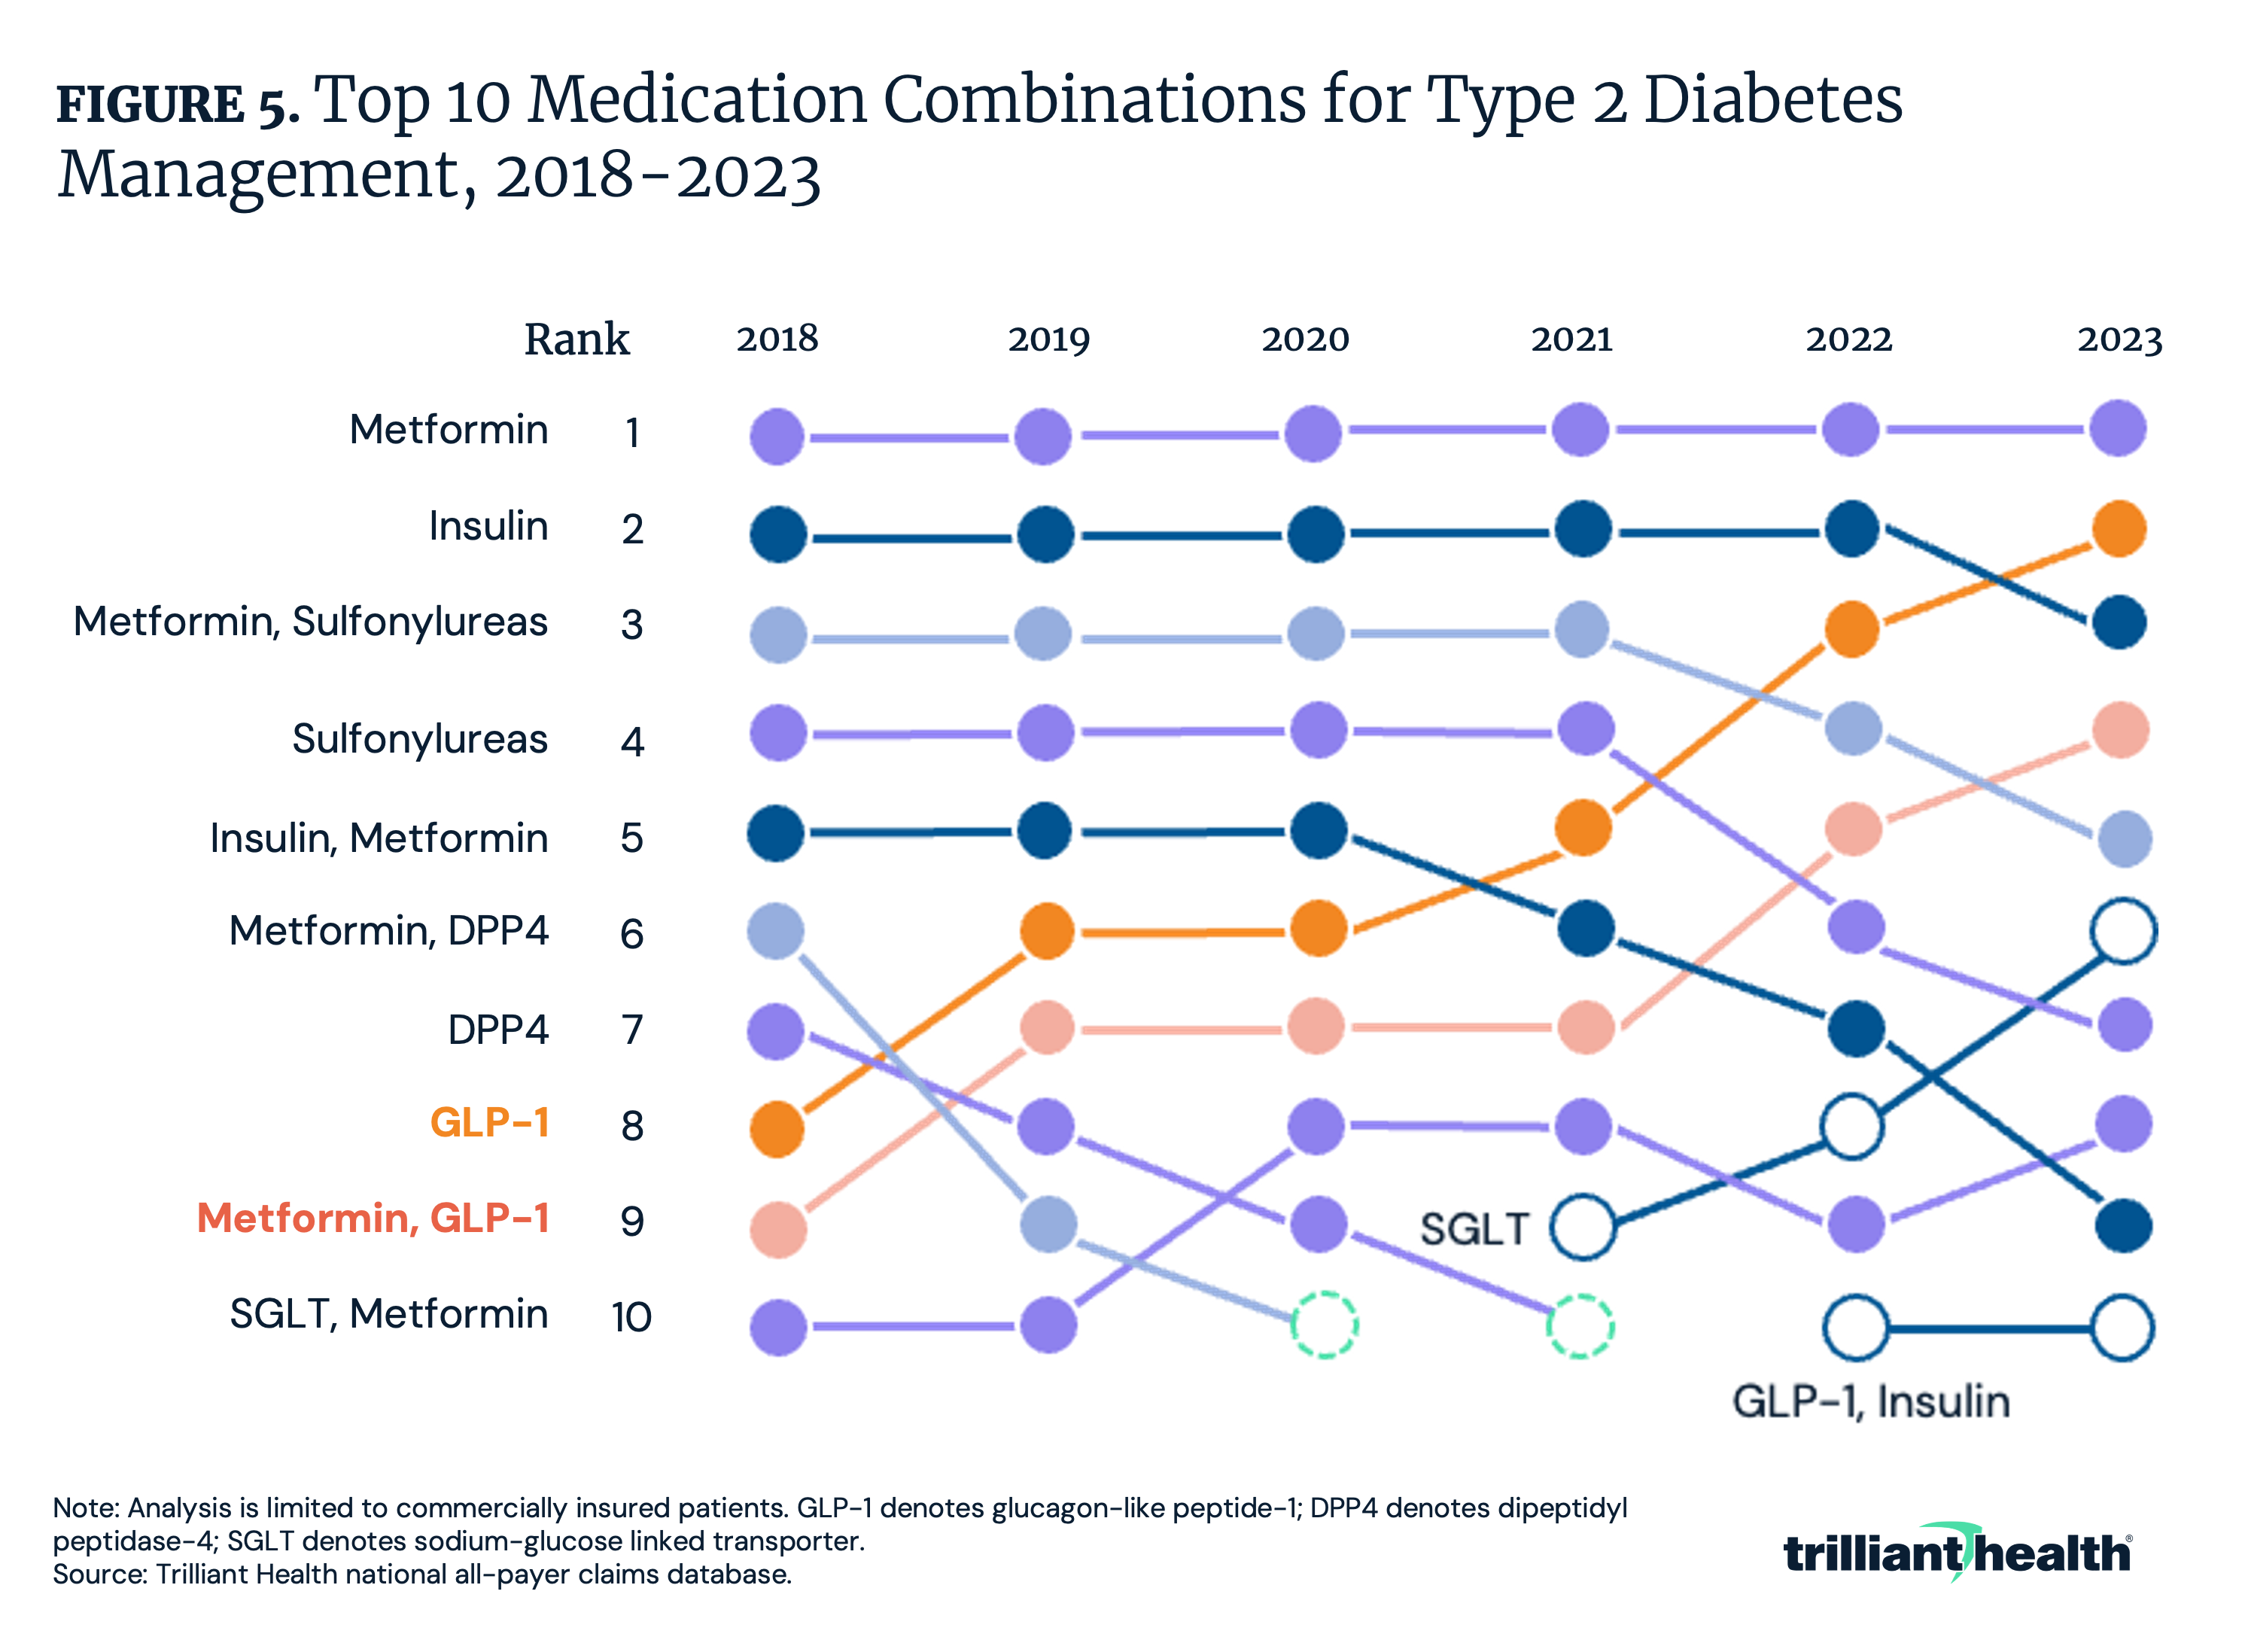
While clinical, technological and pharmaceutical innovations are critical to sustain and advance the health economy, the degree to which certain innovations are increasing or decreasing value remains uncertain. For example, demand for GLP-1s has grown rapidly in recent years, surpassing insulin as the second most common type 2 diabetes medication (Figure 5).
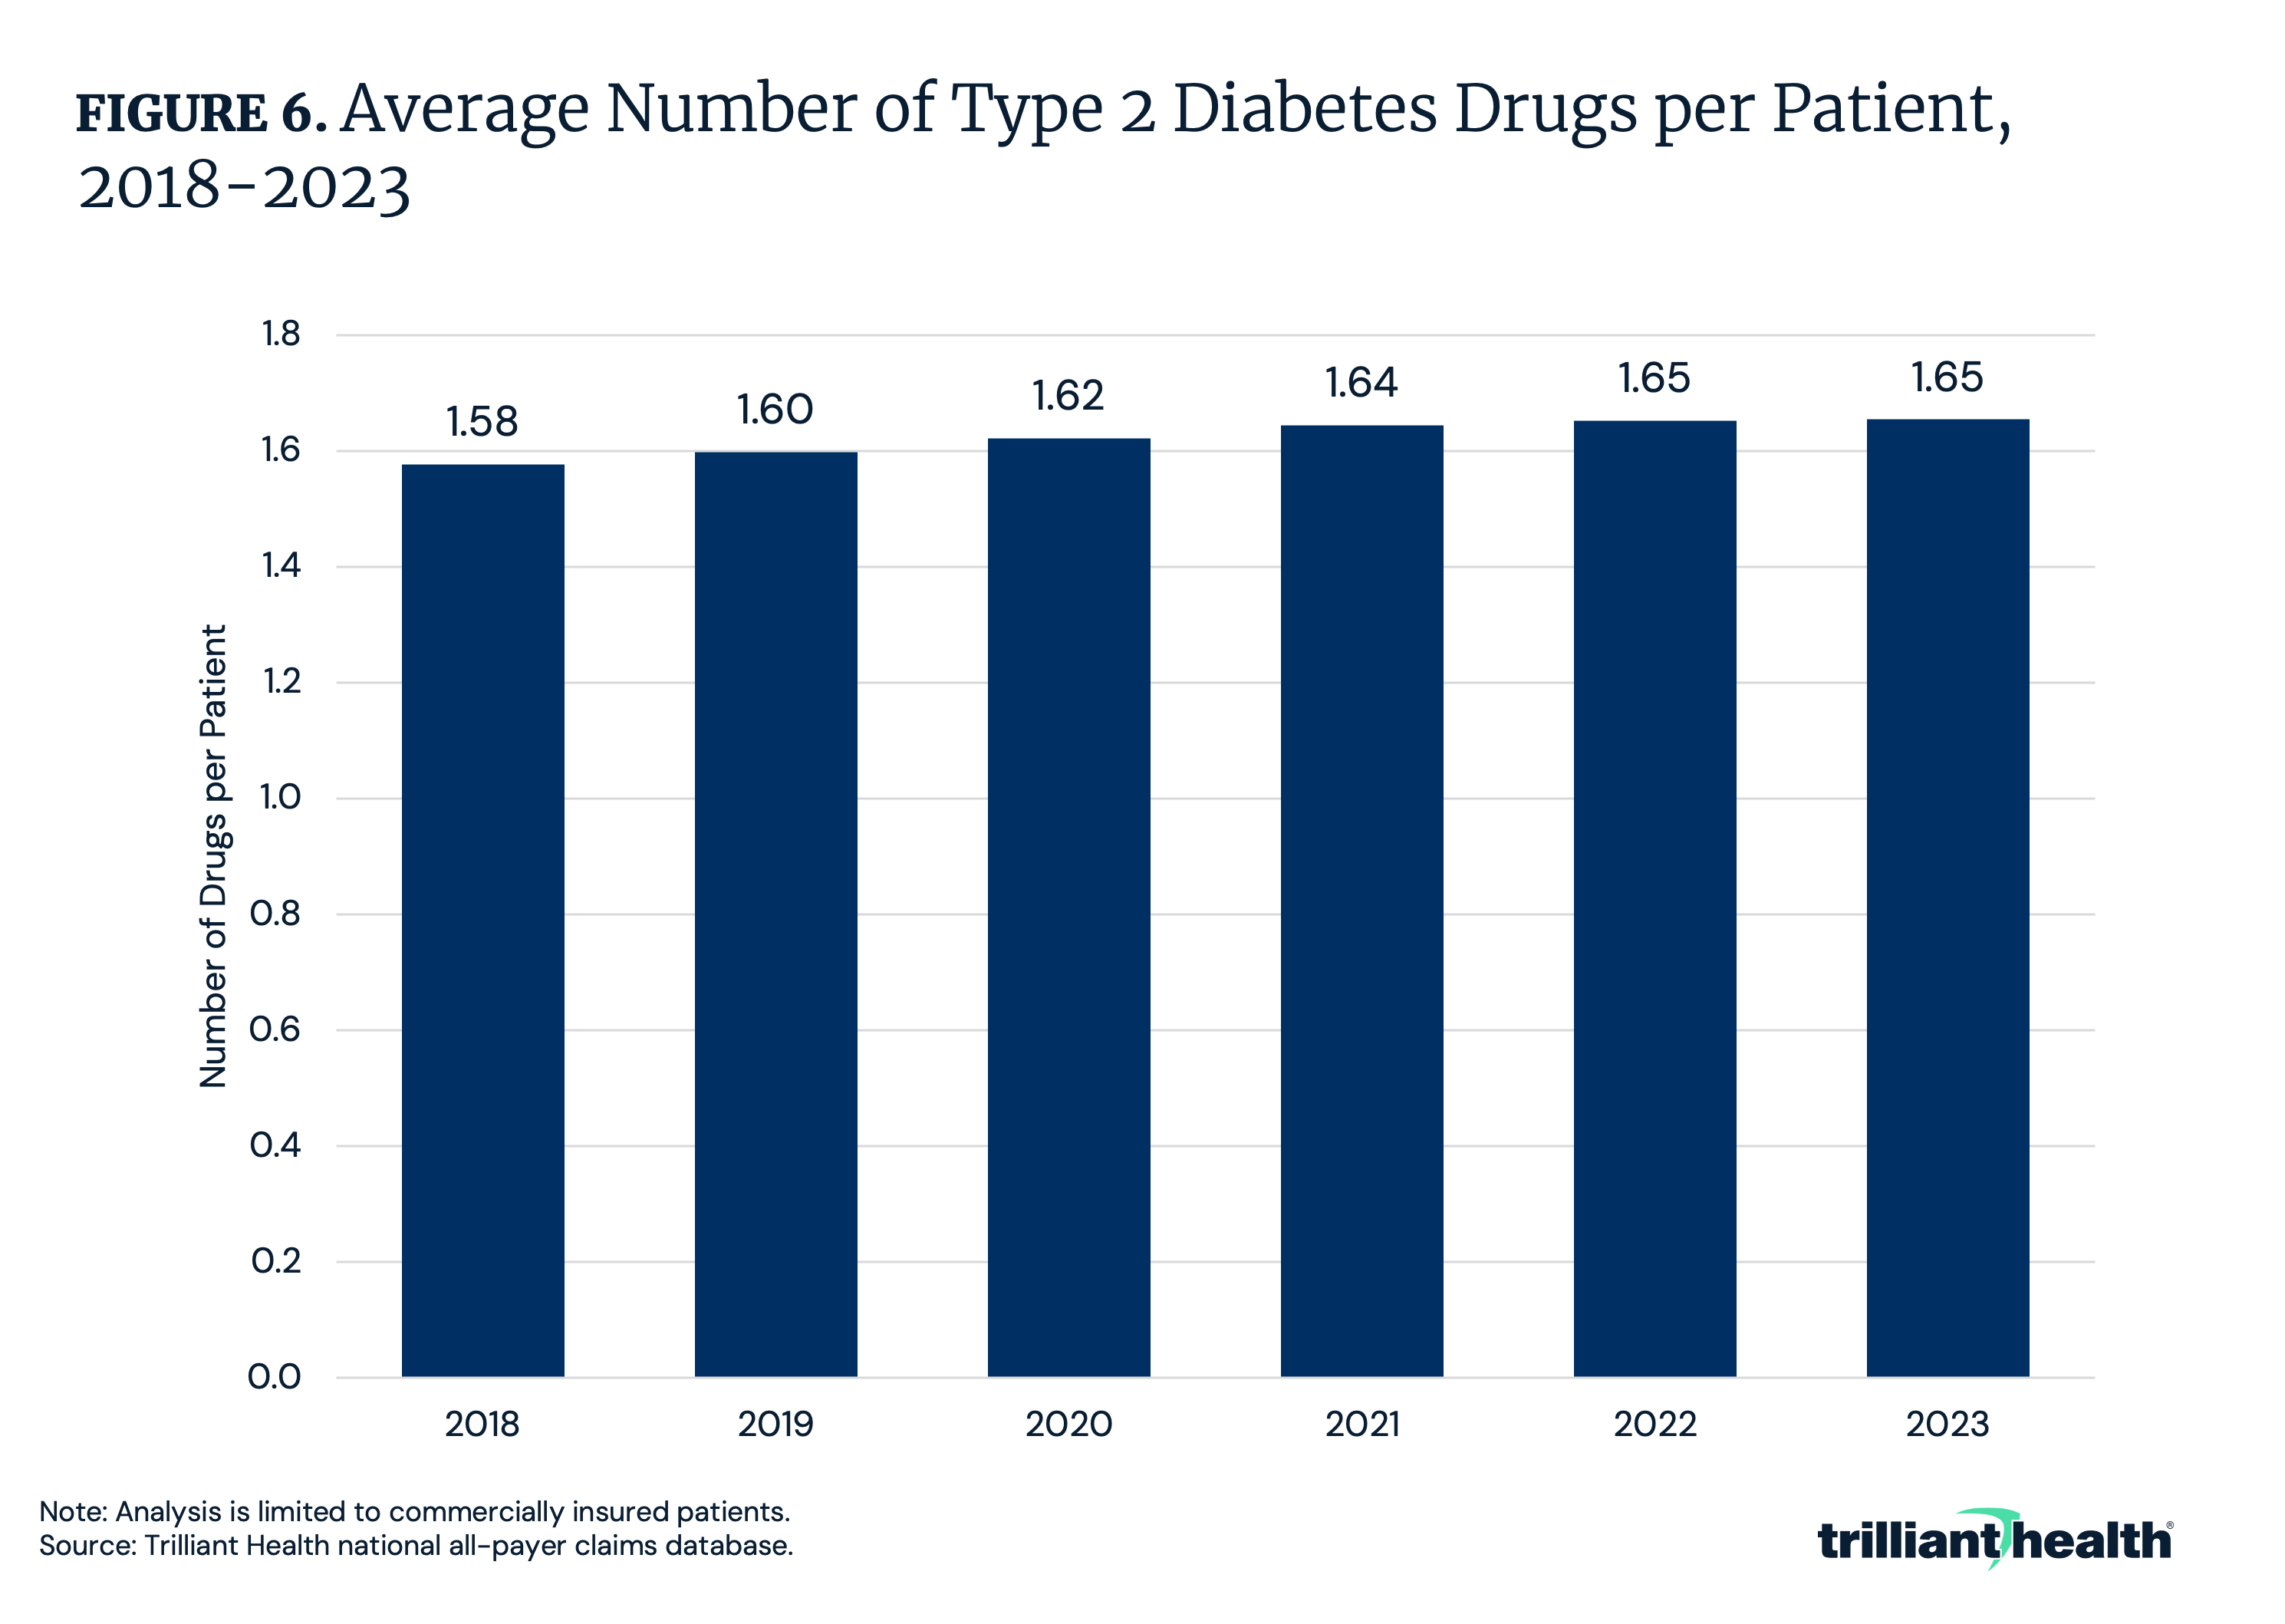
Amid the growth in GLP-1s, the average number of type 2 diabetes drugs per patient also increased, raising the question of whether expanded drug regimens and medication options always lead to better value (Figure 6). With the proliferation of GLP-1s, what will the impact be on American health relative to the amount invested in developing and paying for these medications?
Trend 5: Supply Constraints Are Correlated With Inadequate Yield
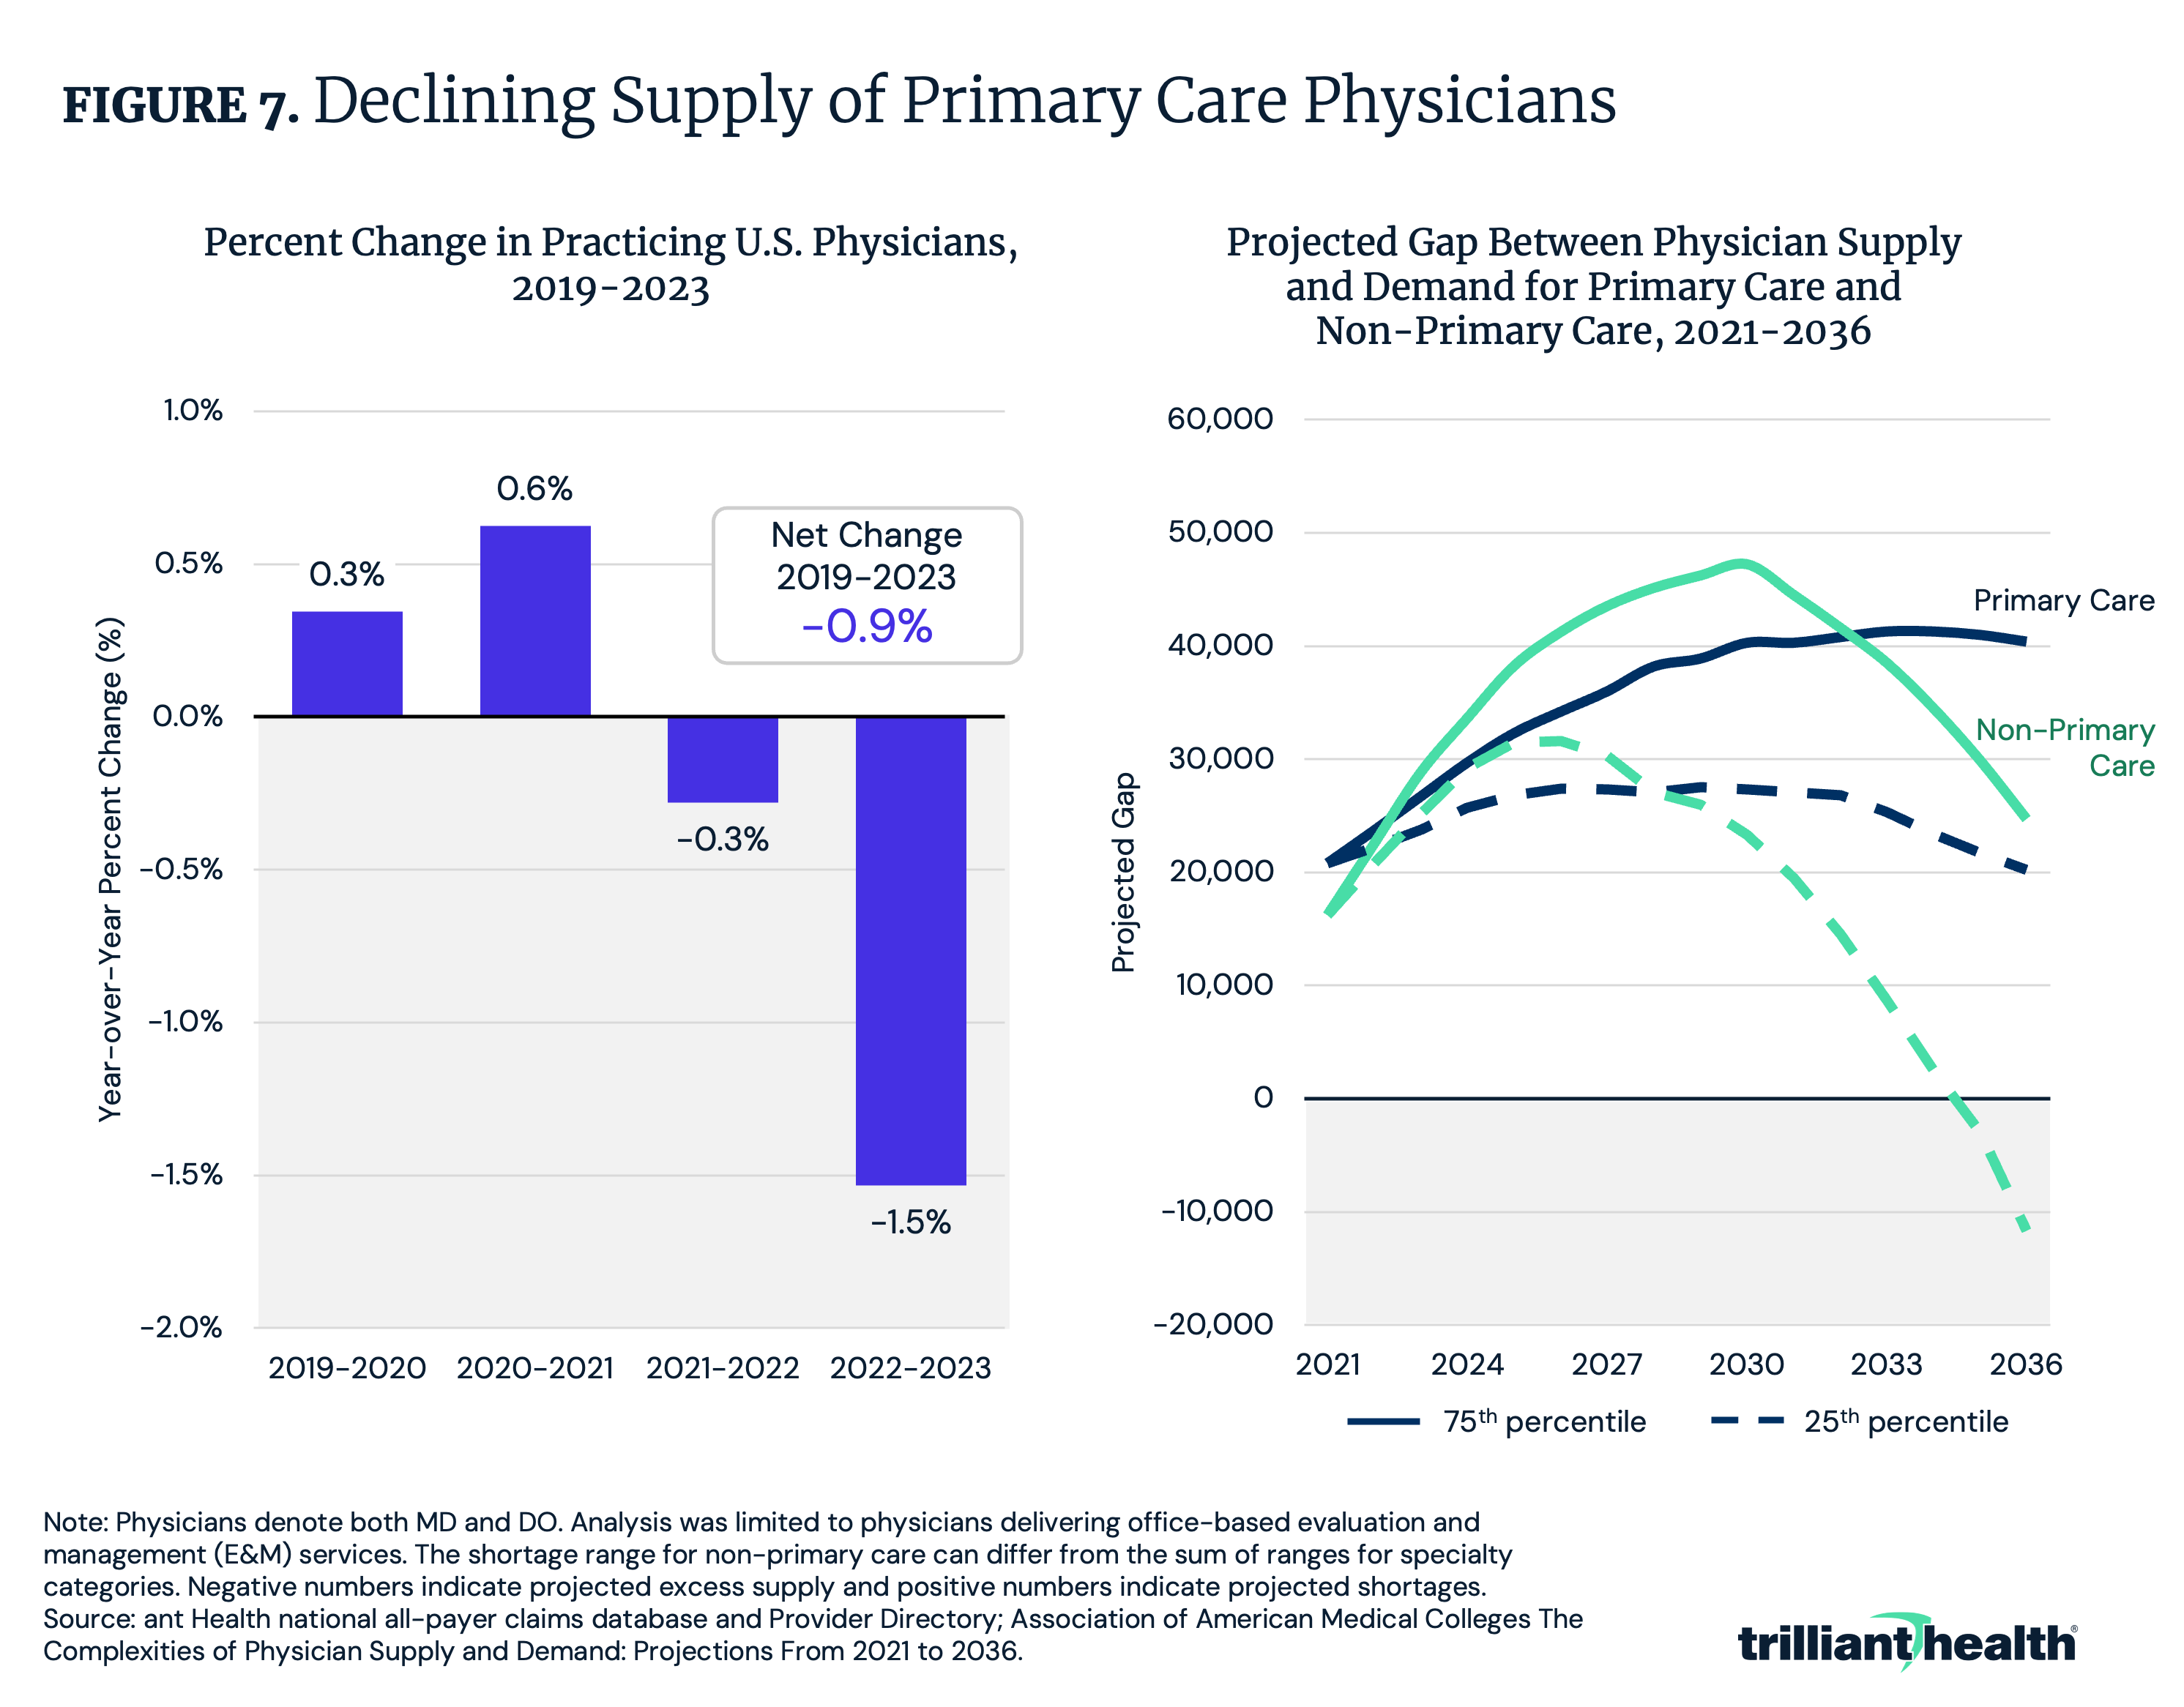
The current healthcare system does not incentivize adequate supply of providers but rather, incentivizes supply where yield (i.e., profitability) is highest. This is further compounded by the fact that the net supply of physicians is declining, with a net change of -0.9% from 2019 to 2023 (Figure 7). Additionally, the gap in primary care physician supply is projected to range from 20,200 to 40,400 physicians by 2036.
This mismatch in supply may be influenced in part by disparities in average annual pay among provider types. Family and geriatric medicine physicians, which are inadequately supplied, are compensated less than adequately supplied specialties like dermatology. As competition intensifies for a shrinking supply of providers, existing shortages for primary care will worsen, further contributing to the declining health status of Americans.
Trend 6: Forced Consumerism Due to Cost Shifting Has Fostered Fragmentation Without Corresponding Value
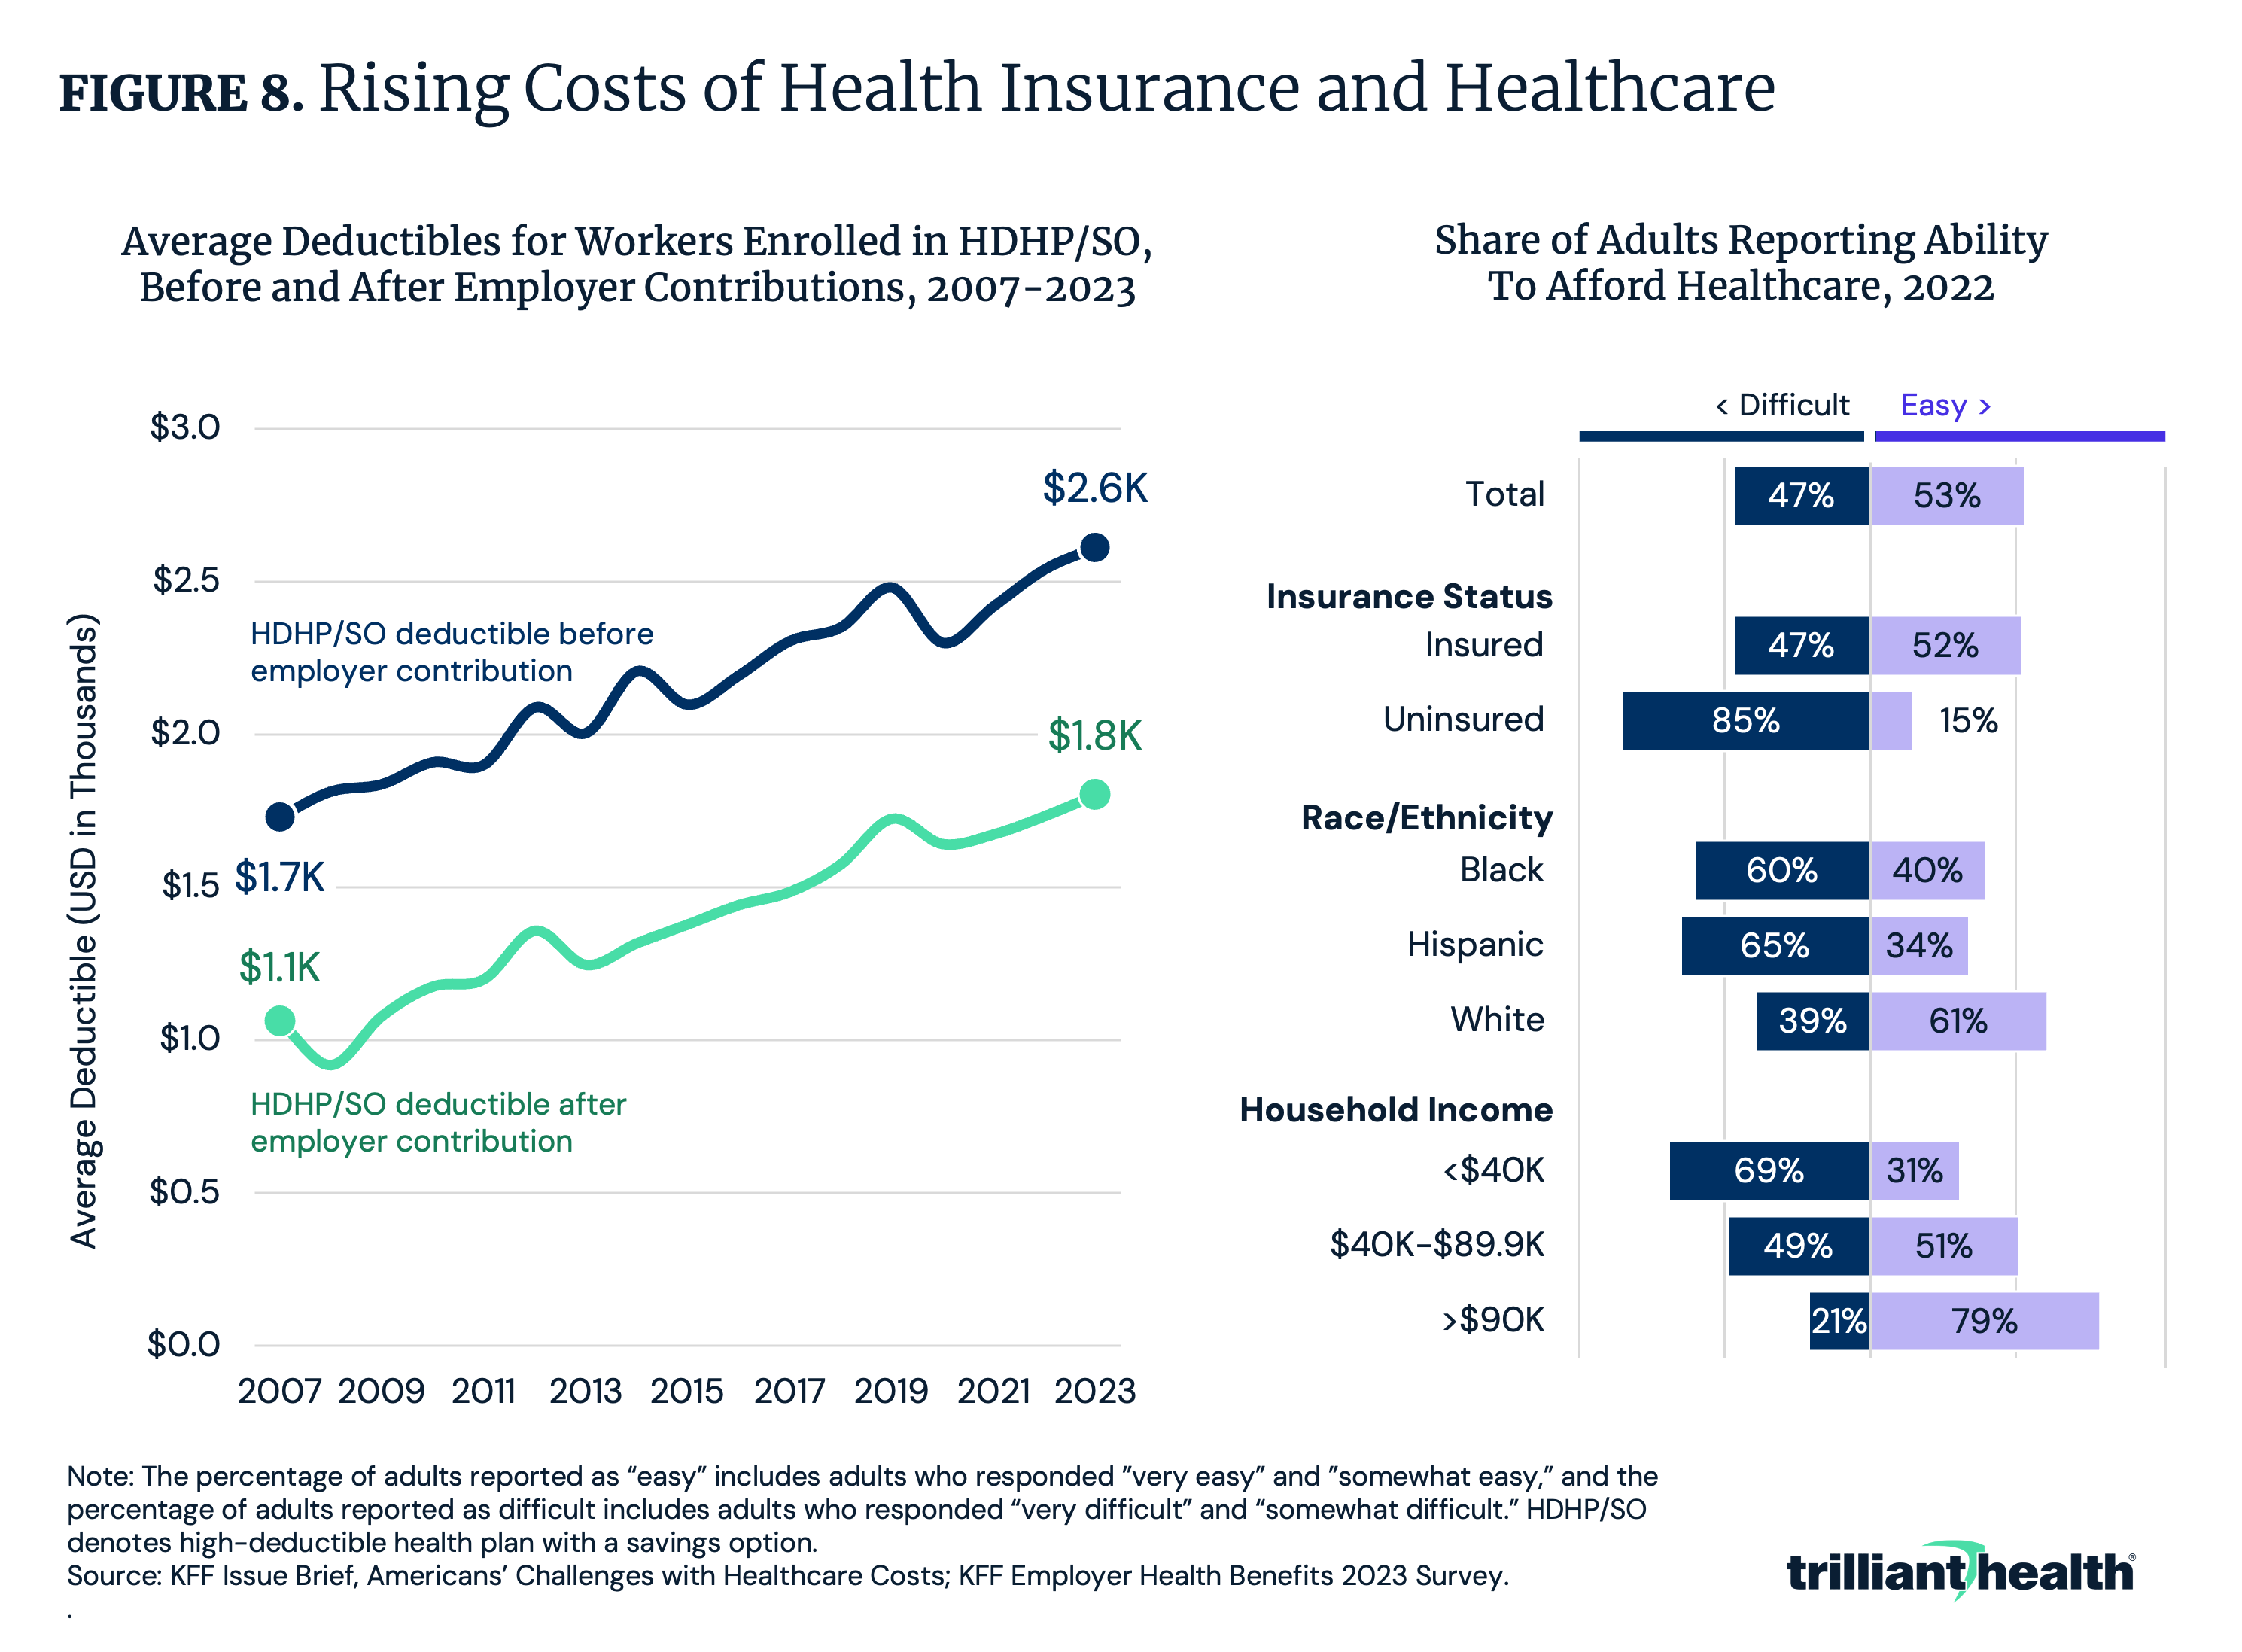
Despite years of experimentation and investment in consumer-focused healthcare innovations (e.g., digital front doors, retail-based clinics), there is little evidence that such a shift has systematically improved outcomes or reduced spending. Notably, 47% of Americans in 2022 reported difficulty affording healthcare (Figure 8). Paying for health insurance has also become increasingly challenging, with deductibles for high-deductible health plans growing by more than 50% between 2007 and 2023. In parallel, trust in the healthcare system is eroding, due in part to the growing unaffordability of healthcare.
Despite persistent affordability concerns and decreasing trust, new models of care are altering the traditional patient journey and introducing more fragmentation – and potential friction cost – than ever before. For example, direct-to-consumer pharmacy entrants increasingly control manufacturing, prescribing and dispensing of medications, potentially driving patients from established provider relationships. If everybody is coordinating care, then nobody is coordinating care, and Americans cannot afford that at a time when they are sicker than ever.
Trend 7: Lower-Cost Care Settings Can Offer Better Value
In theory, the cycle of innovation should expands the amount of care that can be delivered outside the hospital and at lower cost settings, which would improve value. However, the extent to which care can migrate to lower-cost settings will be driven by clinical appropriateness and patient preference.
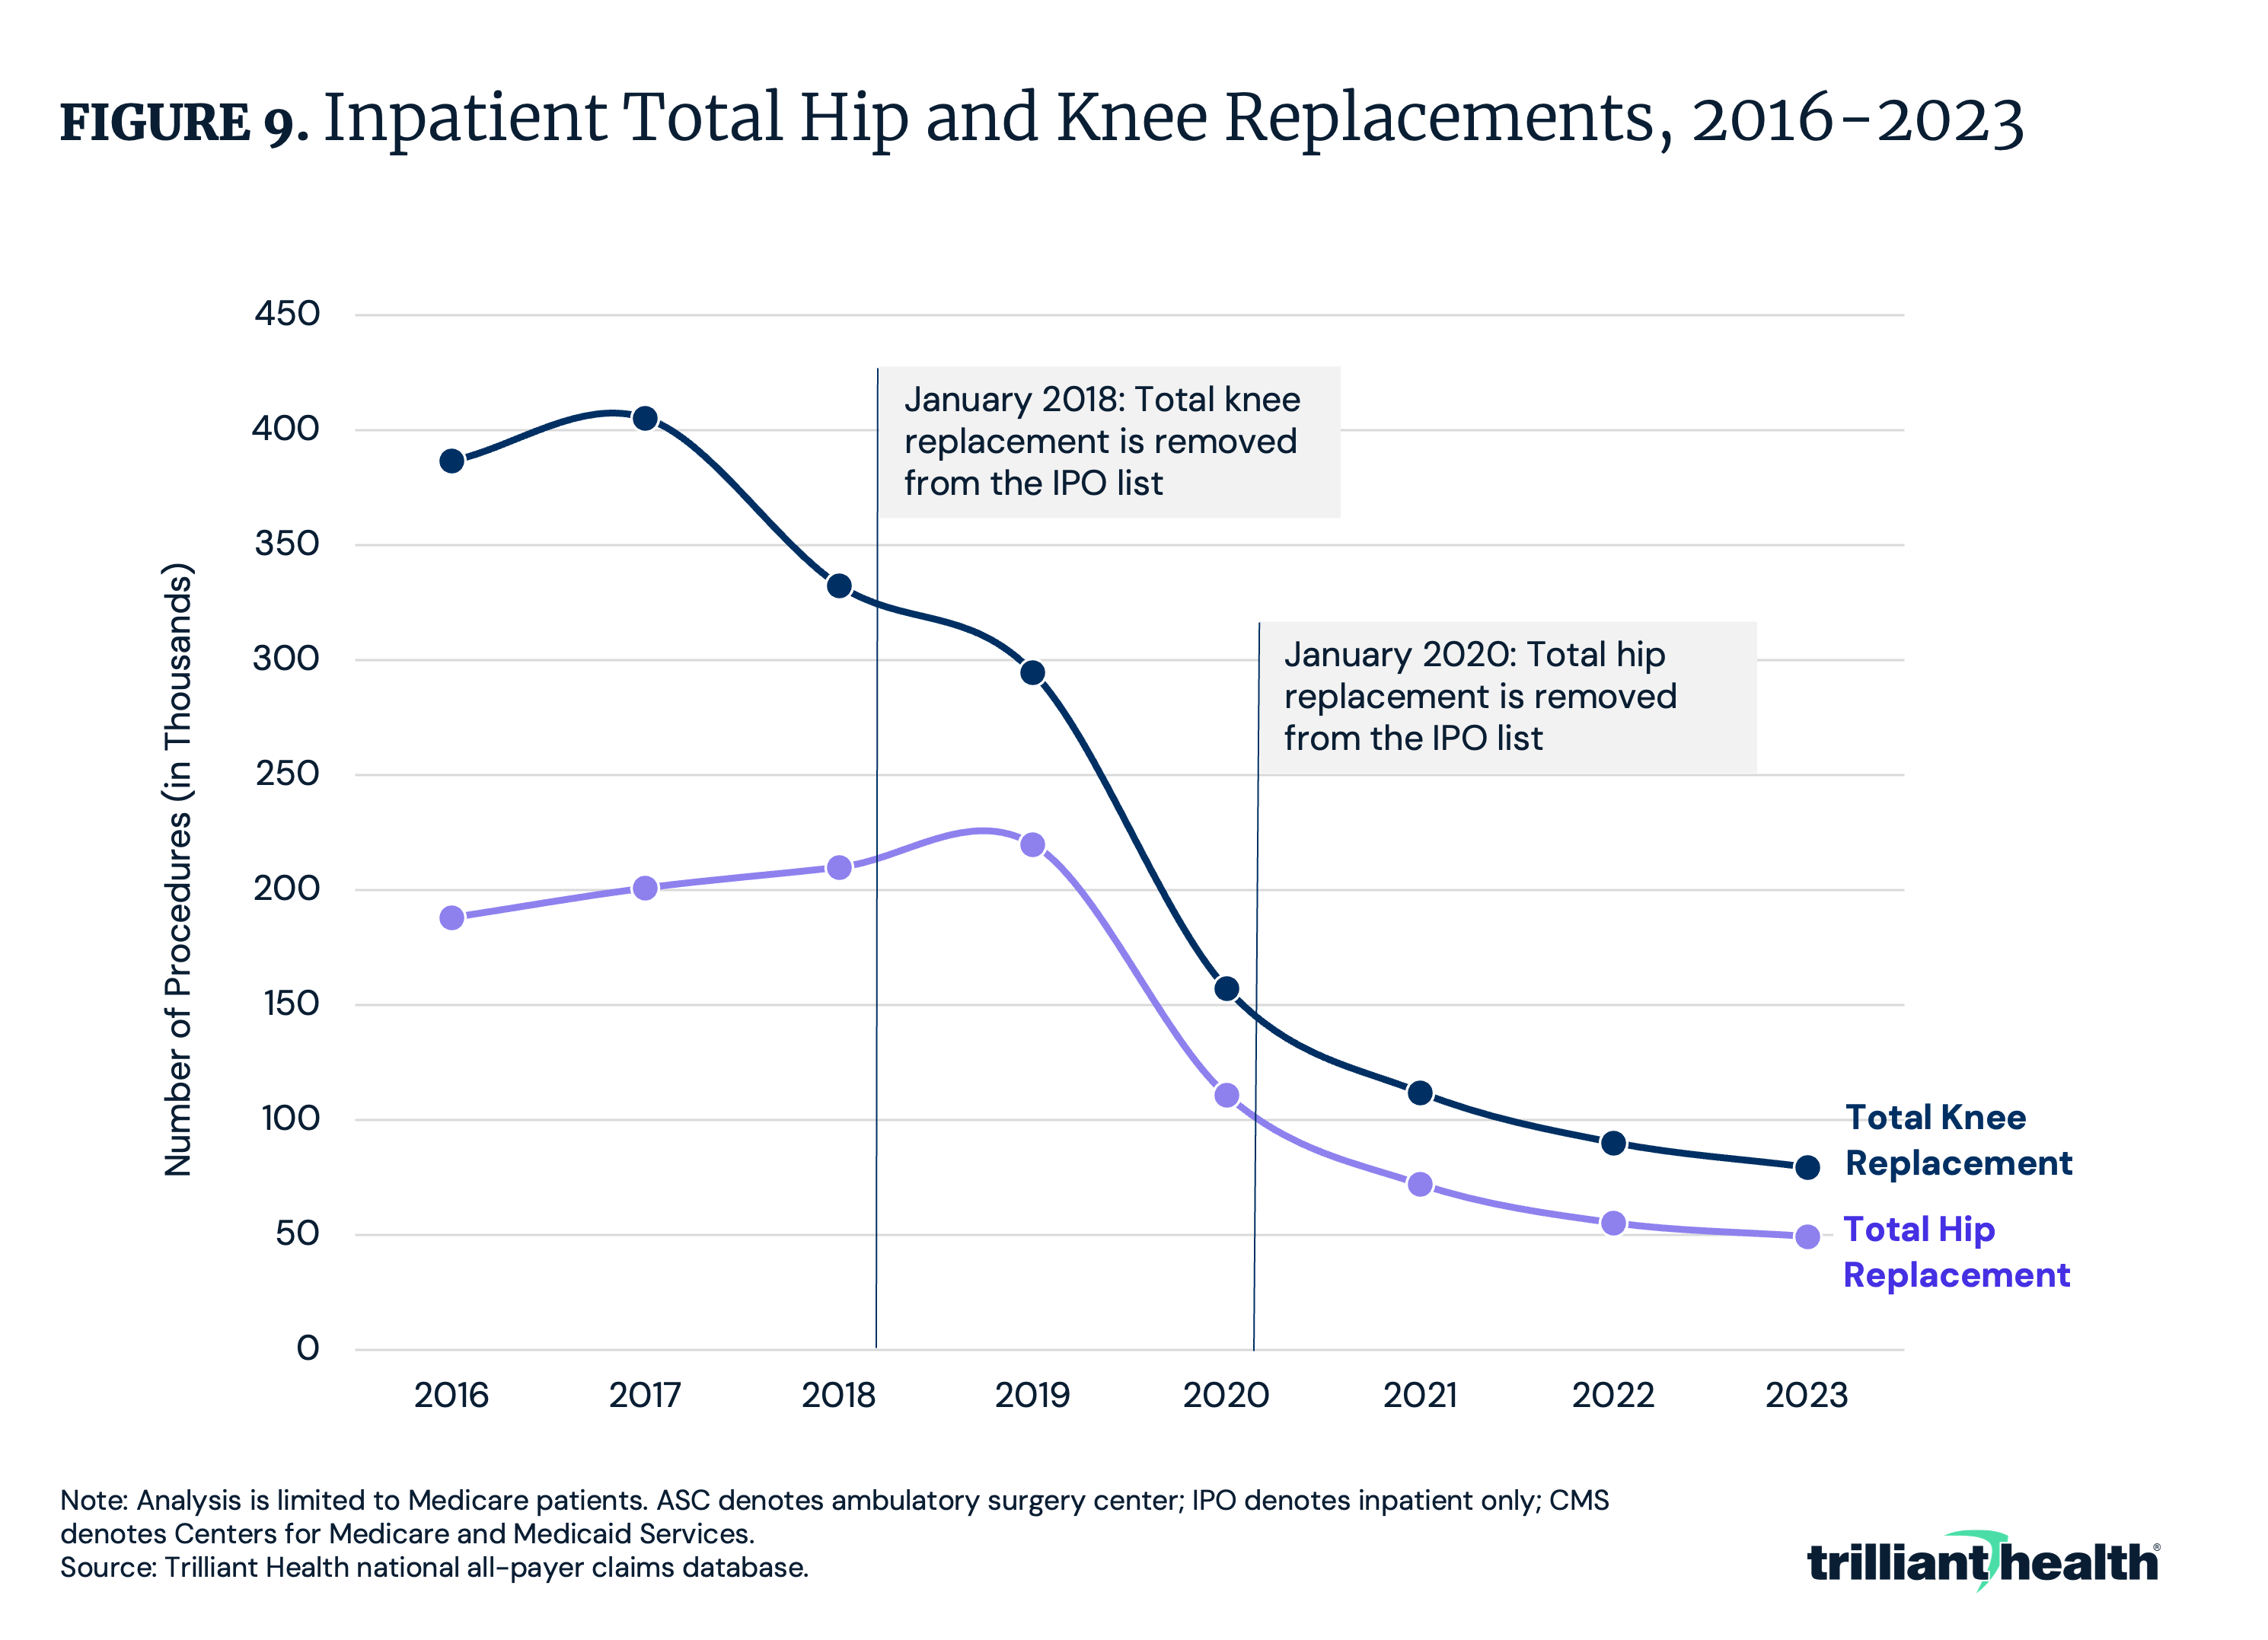
Certain lower-cost settings have already demonstrated better value for select procedures. For example, readmissions, post-surgical complications and costs for total joint replacements are lower in outpatient settings compared to inpatient settings, indicating higher value. As more surgeries are delivered in outpatient settings, as happened following the removal of joint replacement surgeries from the Medicare inpatient only (IPO) list, the more value is created for the ultimate payer, whether an employer or the Federal government (Figure 9).
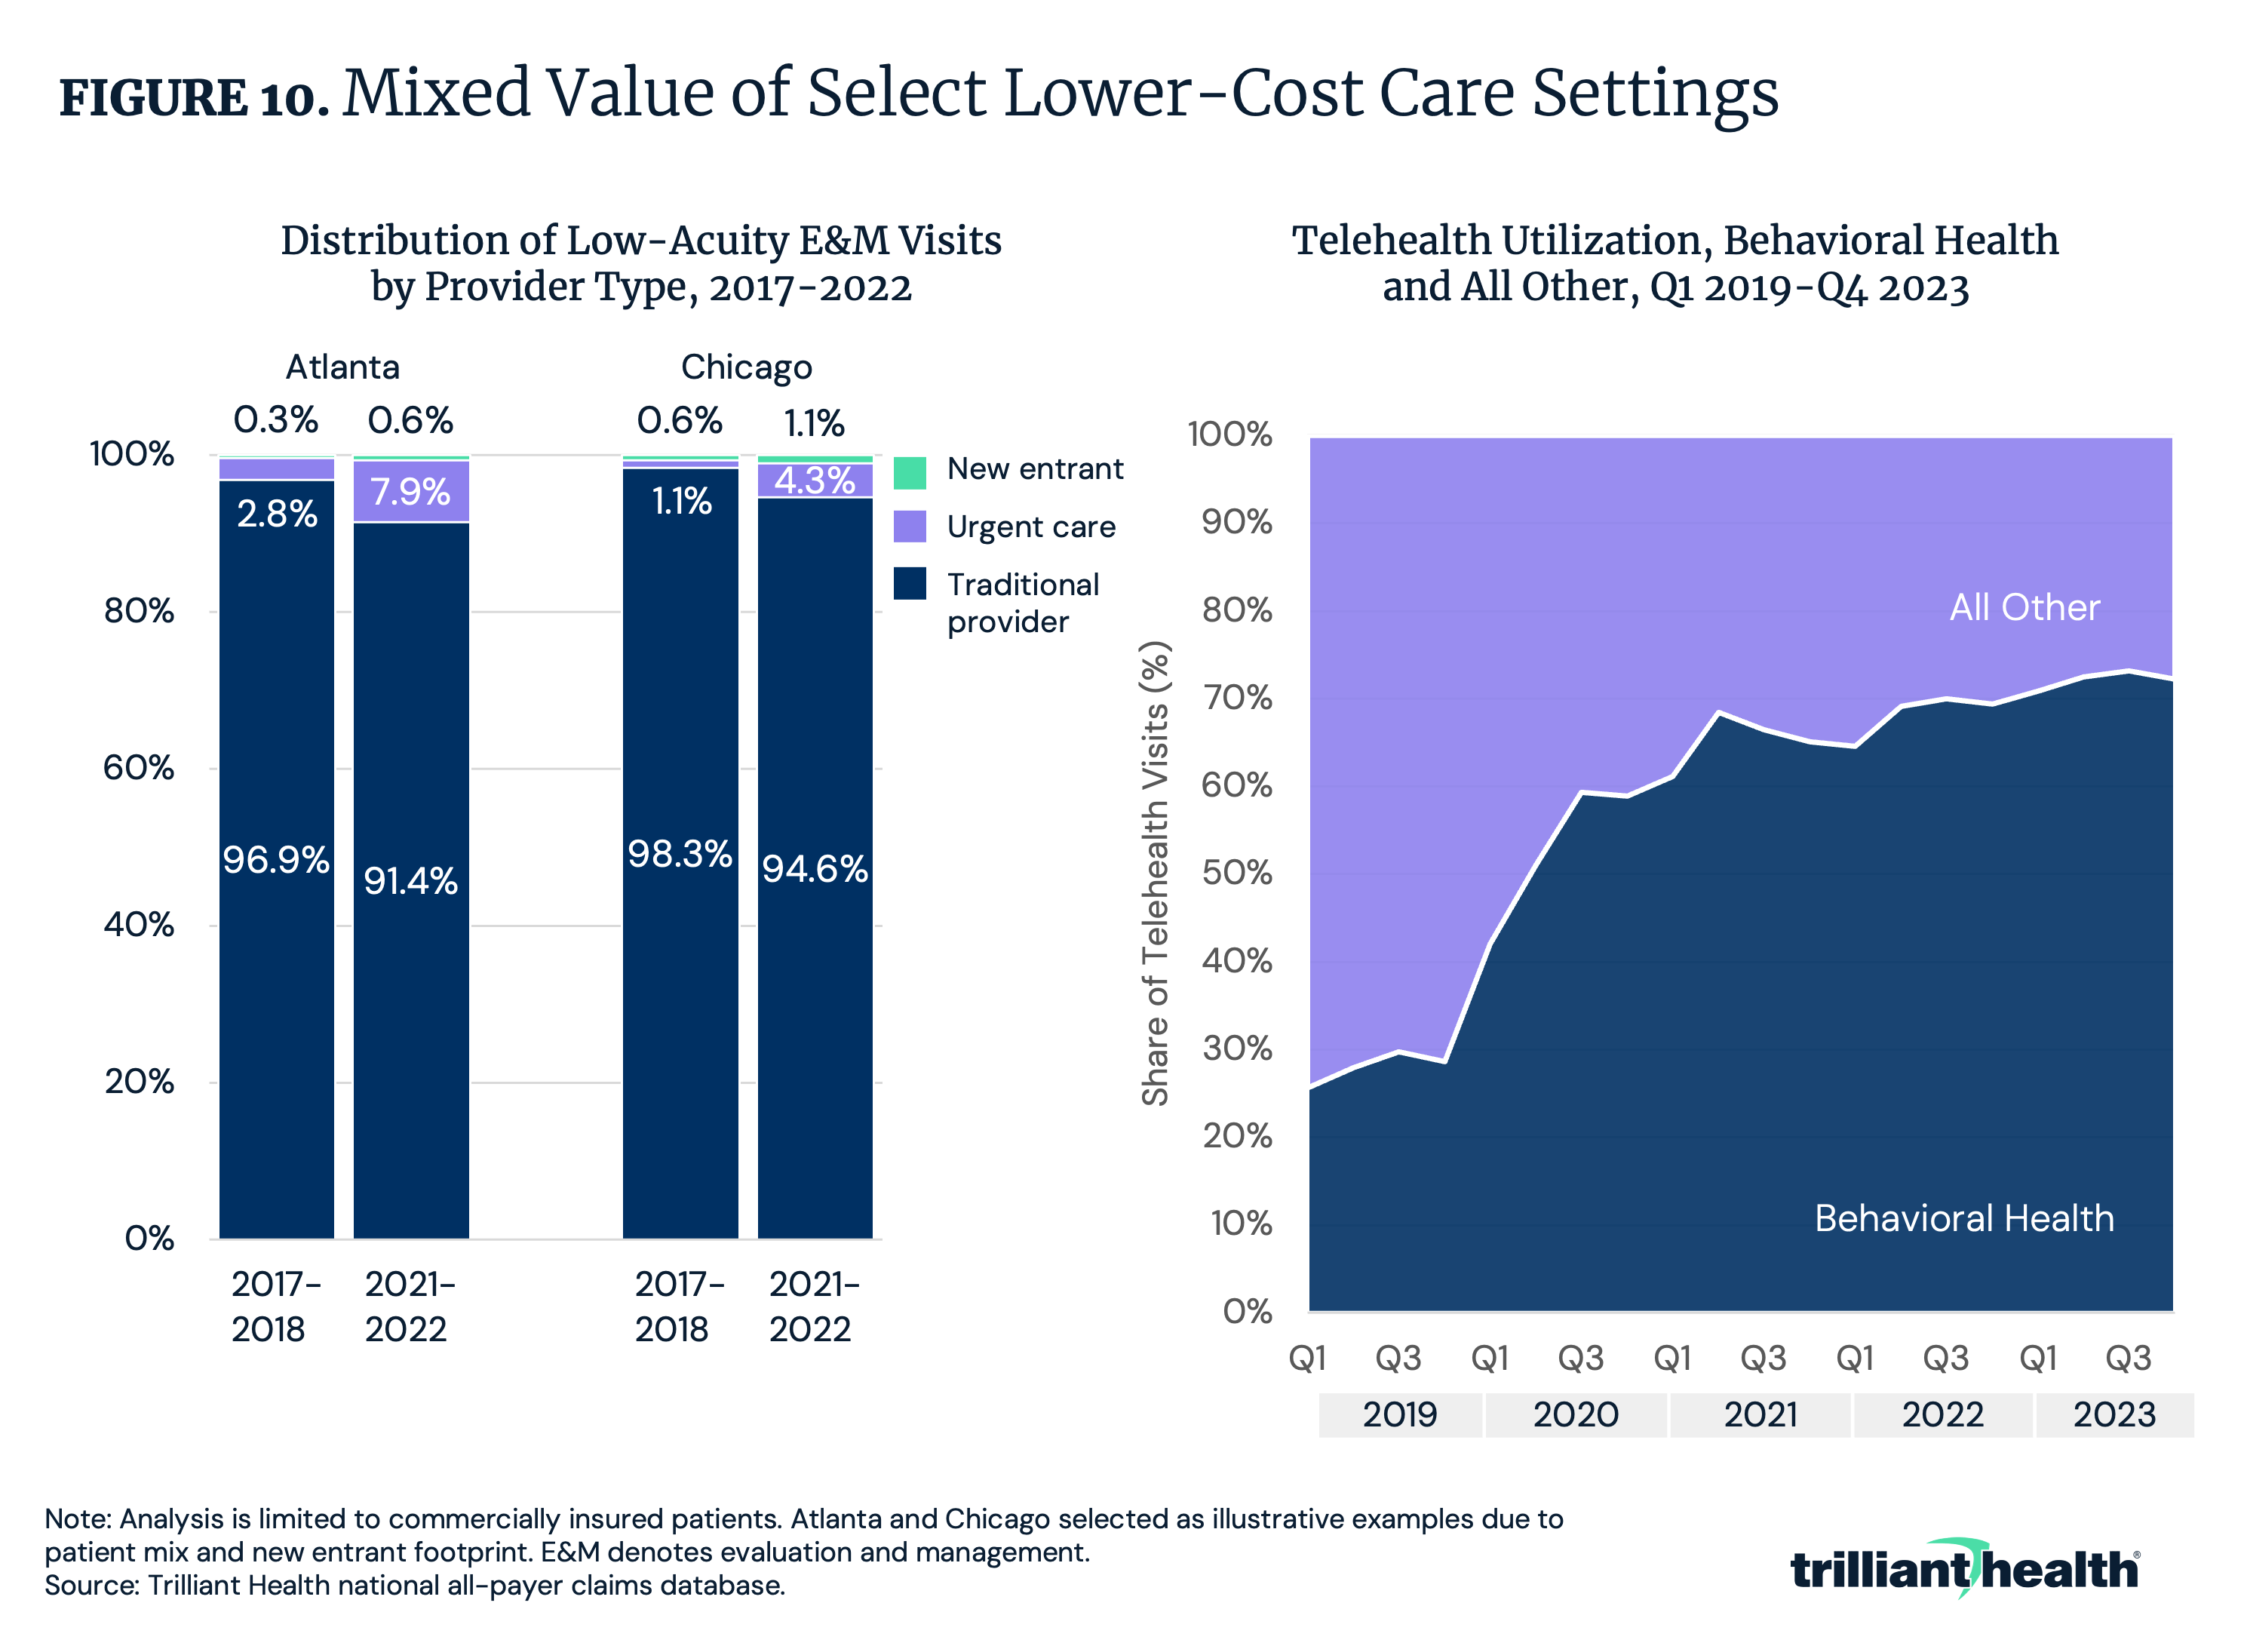
However, not all lower-cost settings have proven to deliver better value to alternative settings of care. For example, new entrants like One Medical, VillageMD and CVS entered the healthcare delivery market with the goal of transforming low-acuity care delivery. However, these providers delivered less than 1% of low-acuity care in key markets, resulting in a nominal impact on actual care utilization patterns (Figure 10).
Additionally, behavioral health continues to be the predominant use case for telehealth, accounting 72.3% of all telehealth volume in Q4 2023. This illustrates the extent to which telehealth is not high value for all clinical applications and has the potential to increase value for a limited number of cases, such as behavioral health.
Trend 8: Employers Are Better Equipped To Demand Value for Money
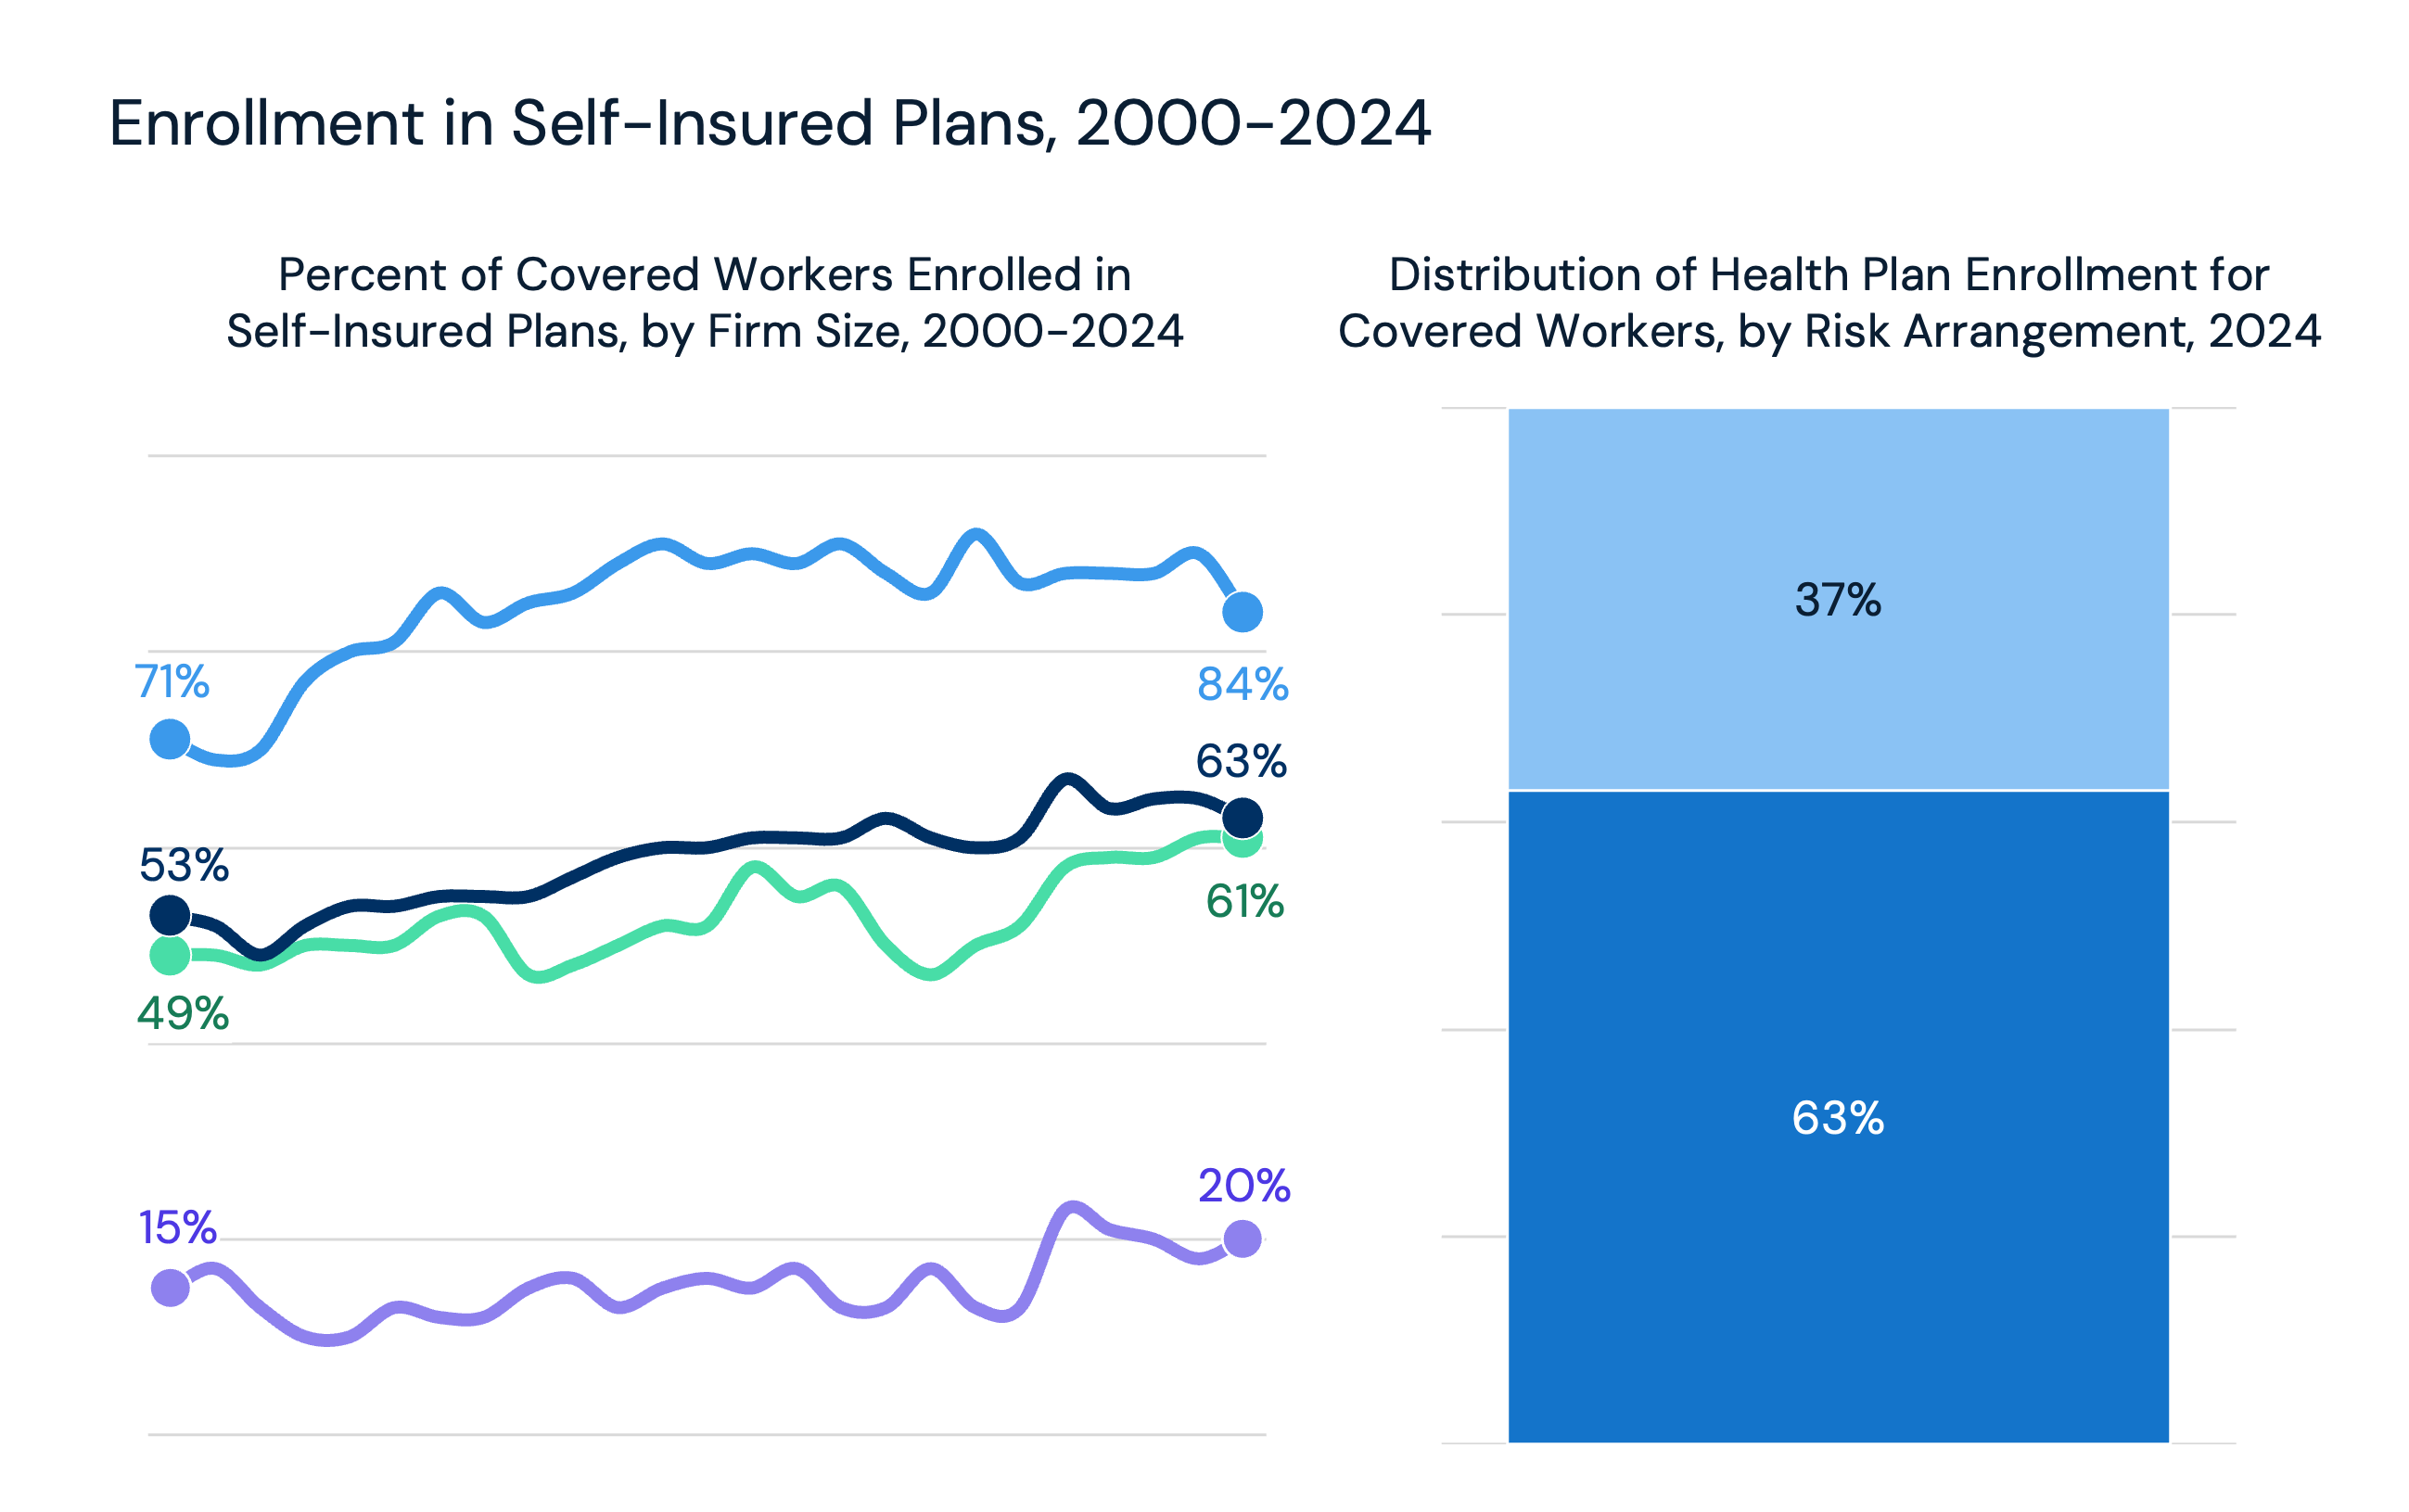
Employers, who insure 60.4% of Americans, fund a substantial portion of the U.S. health economy and have the potential to drive cost containment through their strong negotiating power with payers and providers.1 However, they have not historically leveraged that influence effectively. With rising litigation from employers challenging the fiduciary duty of their third-party administrators and employees suing their employers over improper administration of health benefits, employers are likely to take an increasingly active role in managing healthcare benefits.
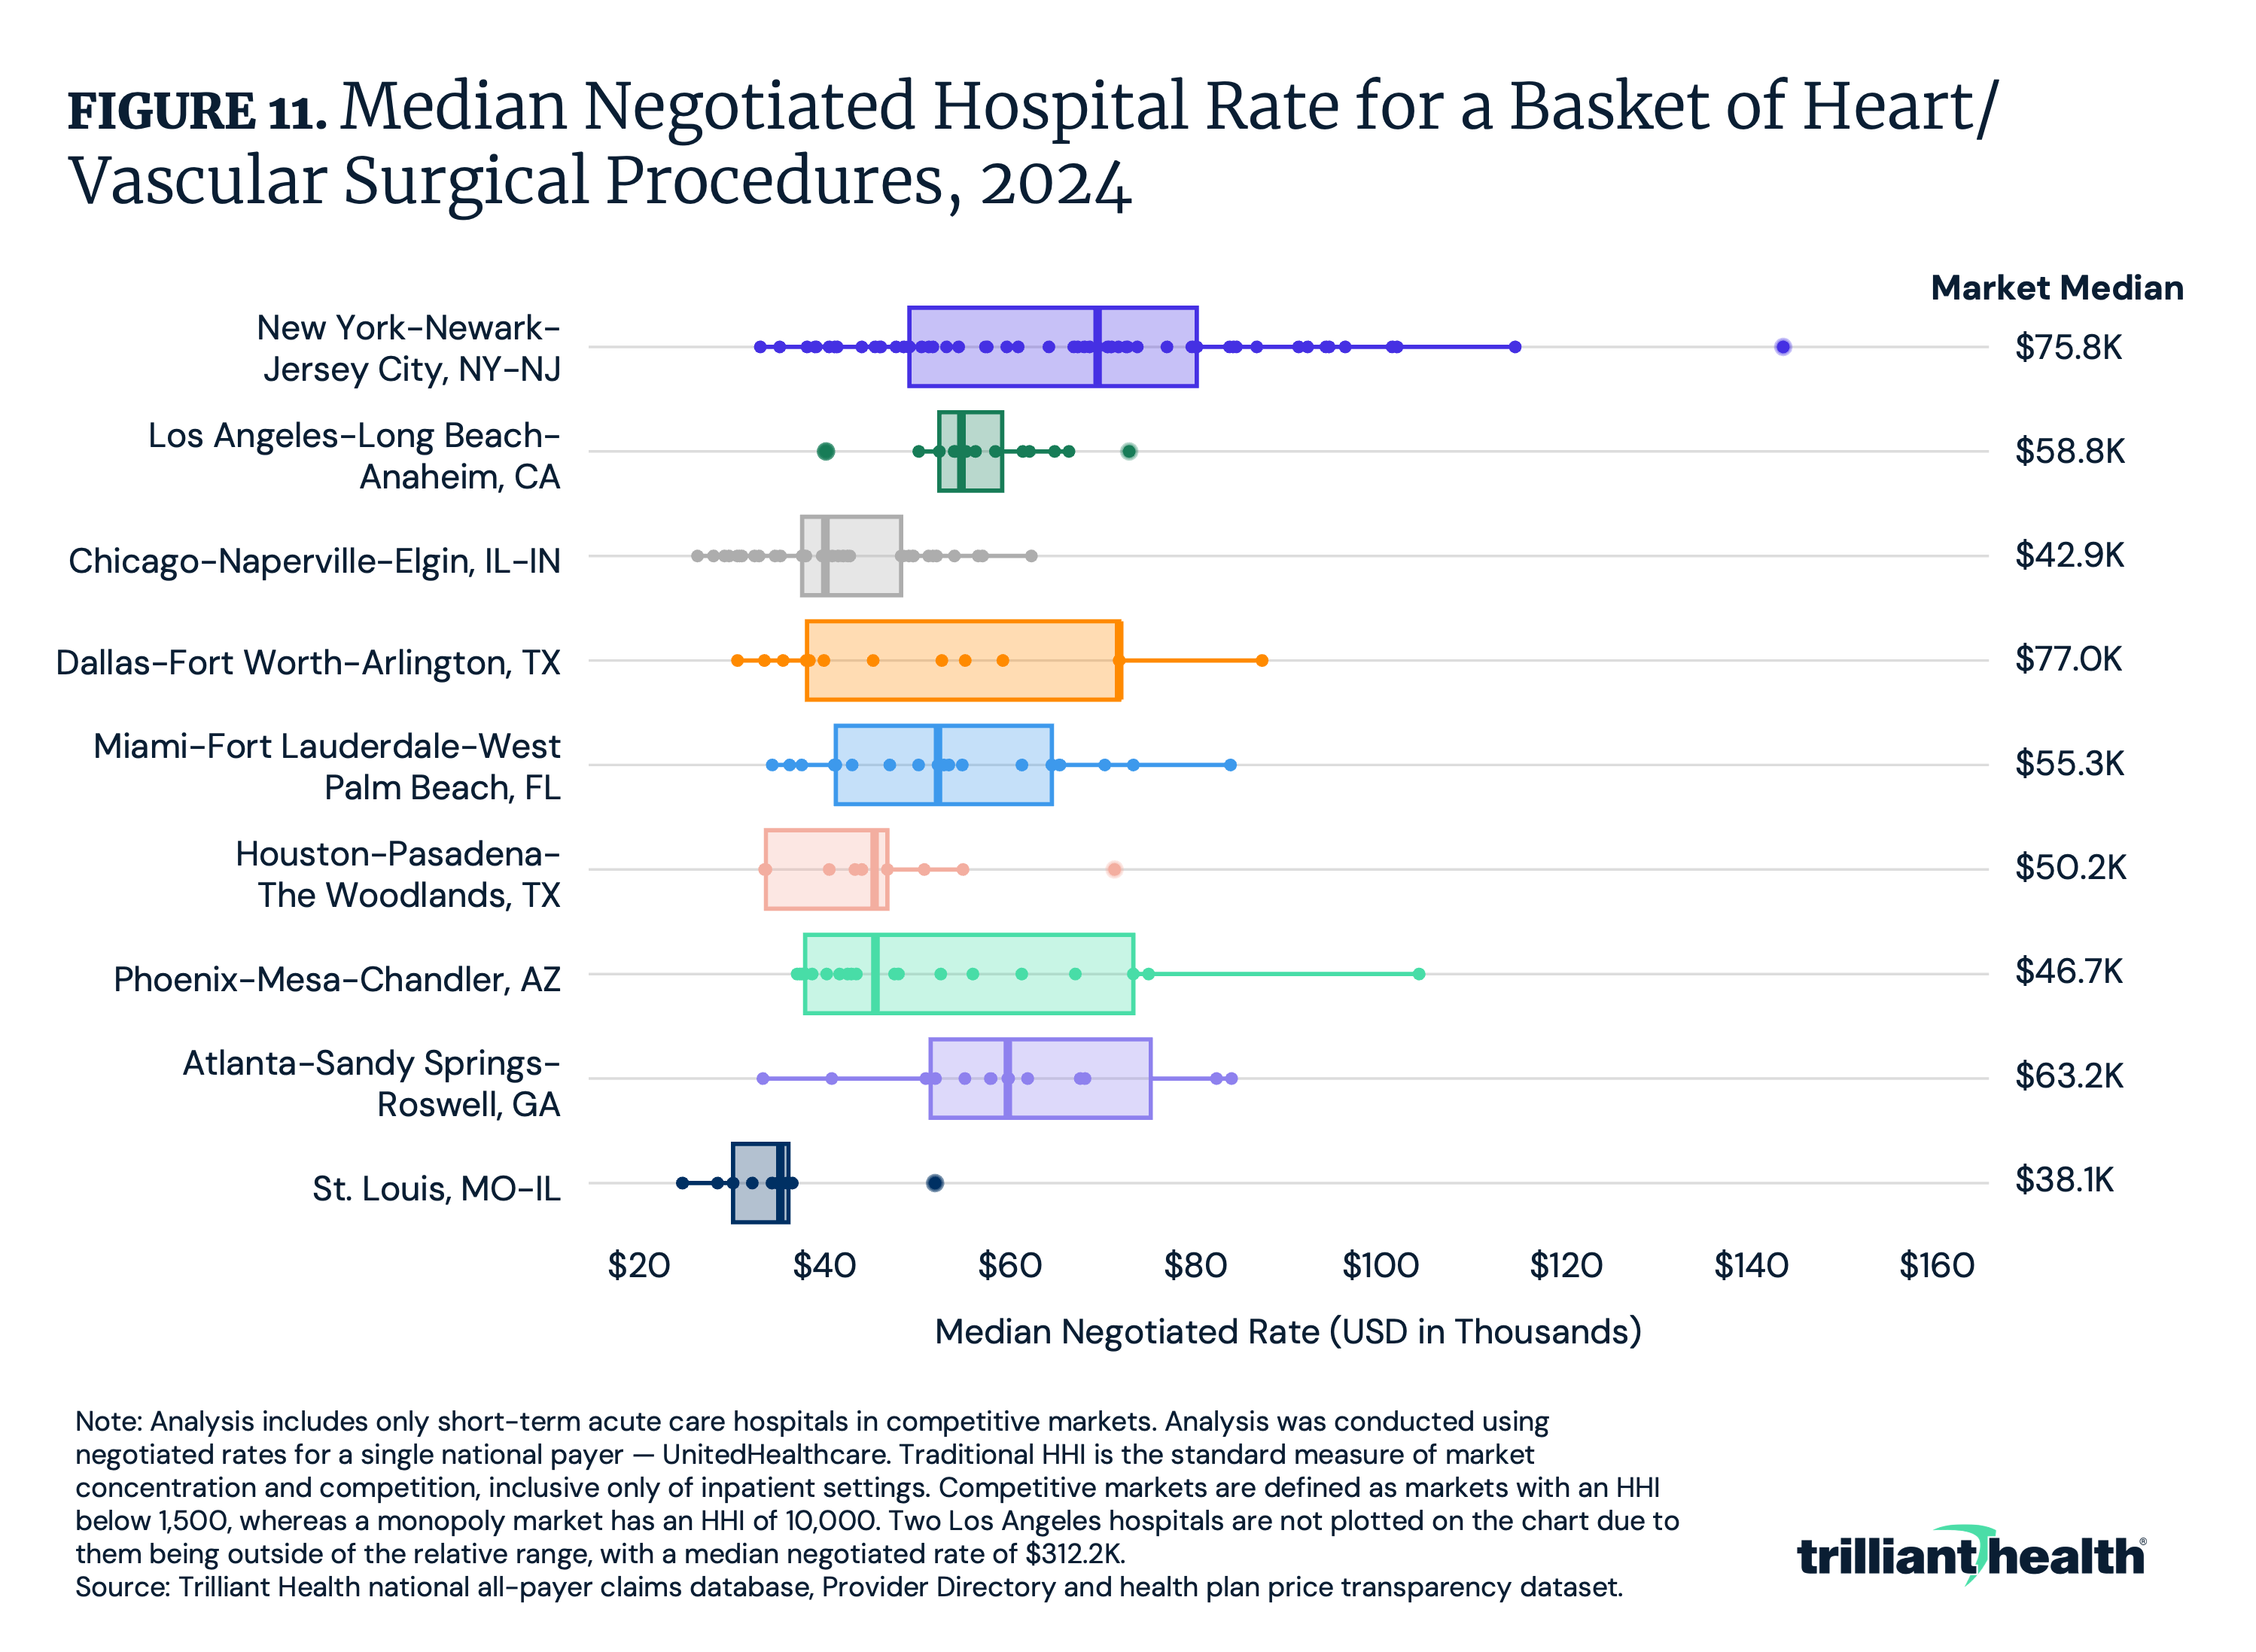
With price transparency enabling greater insight into the lack of correlation between negotiated rates and quality, employers are well positioned to demand value. For example, across a basket four common heart and vascular surgical procedures in select competitive markets, the hospital-level median negotiated rate ranged from $26.5K in St. Louis to $153.8K in New York City (Figure 11). Even within the same market, there is significant variation, which is indicative of wasteful spending.
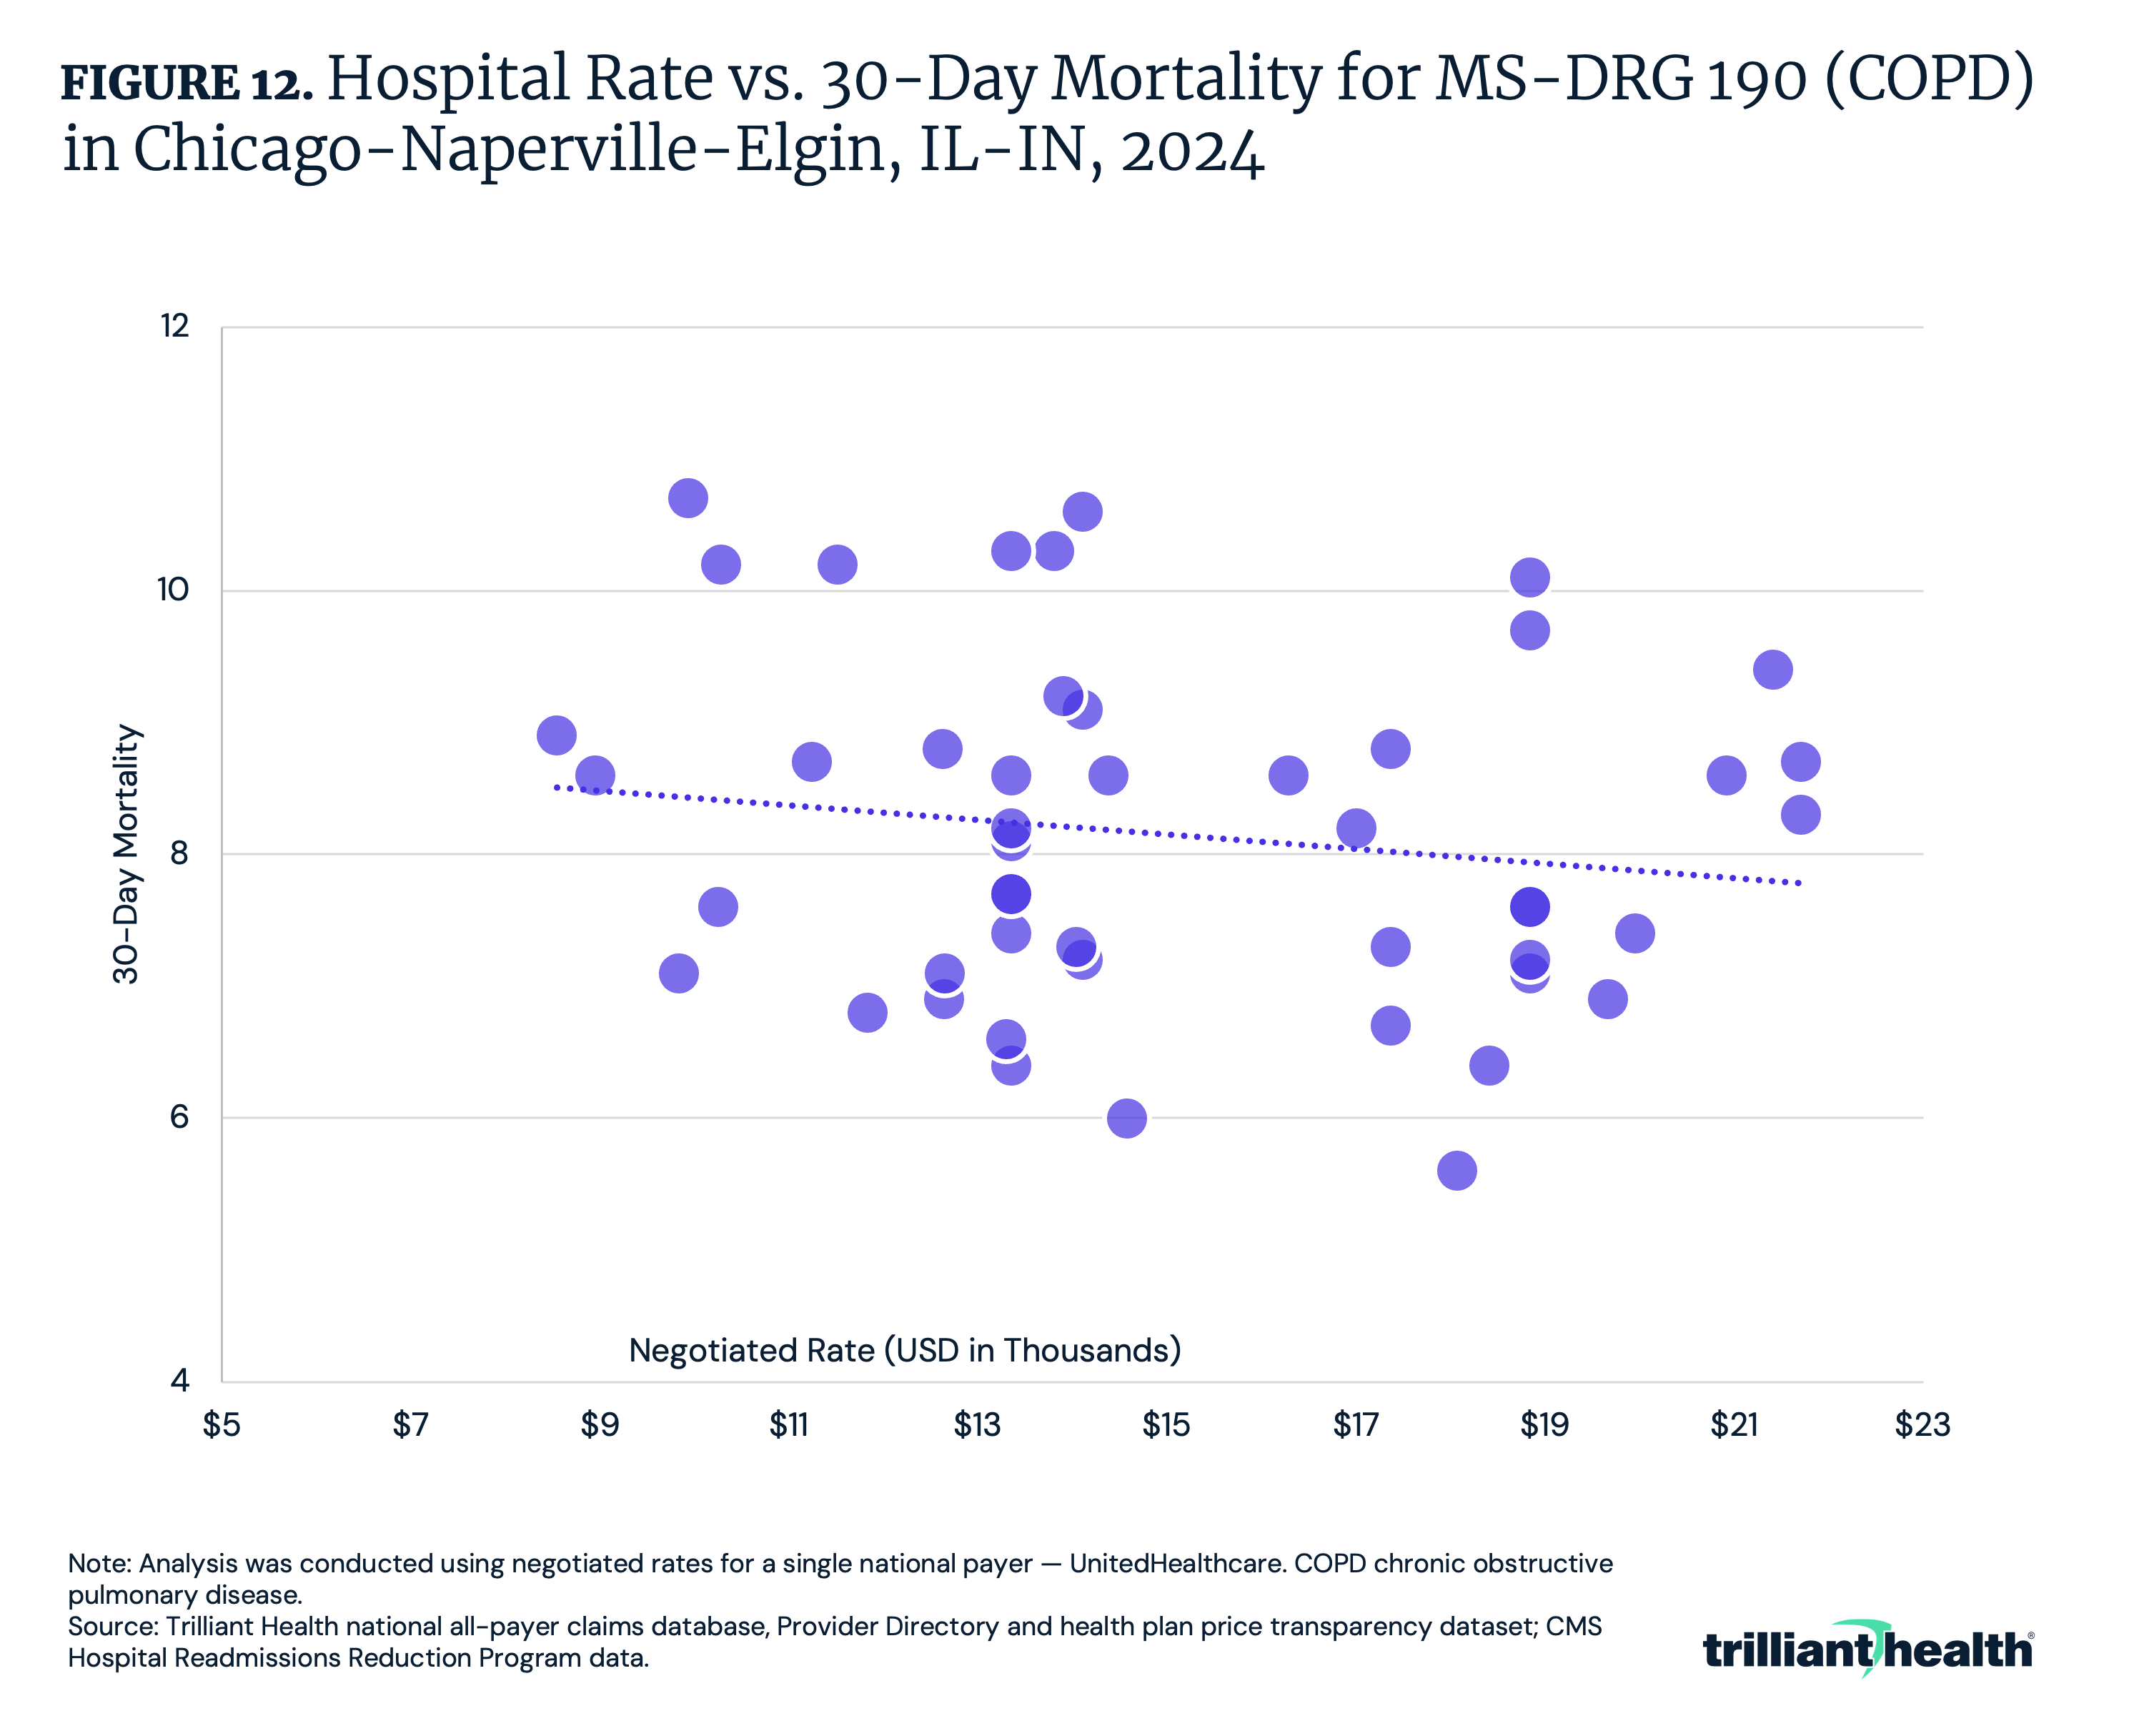
Beyond a wide variation in rates for identical services, price transparency also reveals how price and quality are not correlated. While the median negotiated rate for COPD in Chicago is $14.1K, the provider receiving the highest rate has a higher mortality rate than 66.7% of all other hospitals (Figure 12). Additionally, for these four common MS-DRGs, the correlation coefficient ranges from -0.15 (COPD) to -0.21 (heart failure), reflective of a weak negative correlation between price and quality.
Conclusion
The laws of economics teach that when supply exceeds demand, price (or yield) decreases. How much longer the health economy can continue to defy the laws of economics is a question that every stakeholder should consider. Health economy stakeholders who shift their focus from value maximization for themselves to value optimization for their customers will gain a significant competitive advantage. The unsustainable practice of extracting maximum revenue without regard to cost or quality must give way to a model that prioritizes either better outcomes at equivalent costs or equivalent outcomes at lower costs or the long-hoped-for better outcomes at lower costs. The advent of price transparency unlocks the ability to achieve this. The future of the health economy belongs to those who prioritize optimizing value for their customers by considering price, quality, safety and convenience.