 Ask Oria
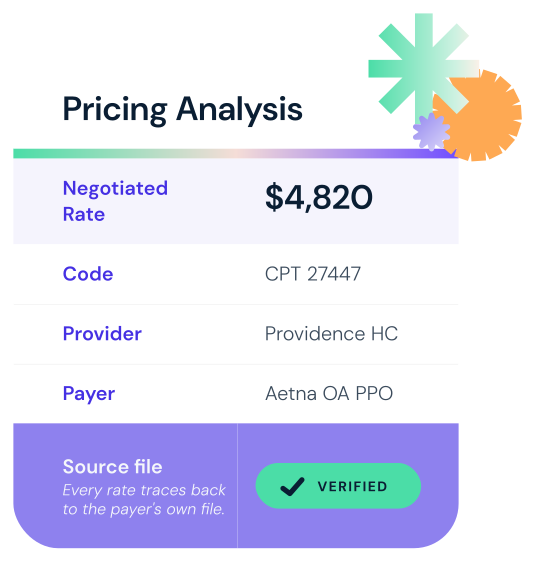
- Access the negotiated rates posted by hospitals
- Gain visibility to the more comprehensive payer MRFs, which have rates for all care settings

THE DATA
Price transparency will unleash an era of value-based competition.
Every stakeholder will eventually be asked to defend their rates — but the raw machine-readable files (MRFs) posted by payers and health plans are massive, messy and full of duplicates, not ready-made answers. Using them requires context: who gets paid what, where, compared to whom and over what time.
What the market rates are today...

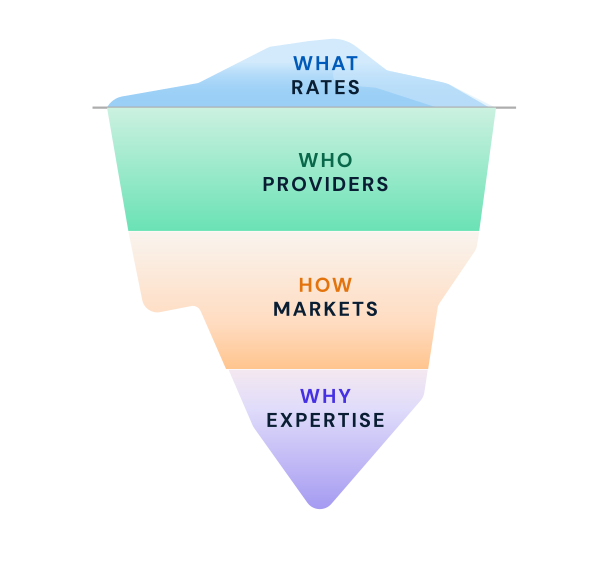
What • Rates
Both price transparency sources

Who • Providers
Provider data to build relevant cohorts
- Build provider cohorts based on specialty, affiliations and practice location
- Contextualize with information from our proprietary Provider Directory

Where • Market
Context about broader market dynamics
- See how rates correspond with market share gains and losses
- Understand how rates influence payer mix
... and tomorrow

WHAT'S NEXT
Deliver more value for money
- Develop pricing strategies that align rates with quality
- Track how the market rate changes over time to inform future negotiations
200+
Commercial payers
3.1M
Provider profiles
7.2B+
Rates posted by hospitals
4,700+
Hospitals with verified disclosures
Pricing Strategy
Compete by providing value for money.
In order to compete in healthcare's negative-sum game, providers must deliver value for money, which requires understanding what is being paid in your market to your competitors for equivalent services. Providers can deliver value for money by providing better quality at the same price, the same quality at a better price or – the holy grail – better quality at a better price.
RAW DATA
RAW DATA
WHAT • RATES
What is the market rate for products and services?
HOW WE ANALYZE HEALTHCARE PRICES
HOW WE ANALYZE HEALTHCARE PRICES
WHO • PROVIDERS
Who should we benchmark our rates against?
HOW • MARKET
How do rates shape our market position?

WHY • EXPERTISE
Why do rates differ, and is it sustainable?
What are the market rates for healthcare products and services?
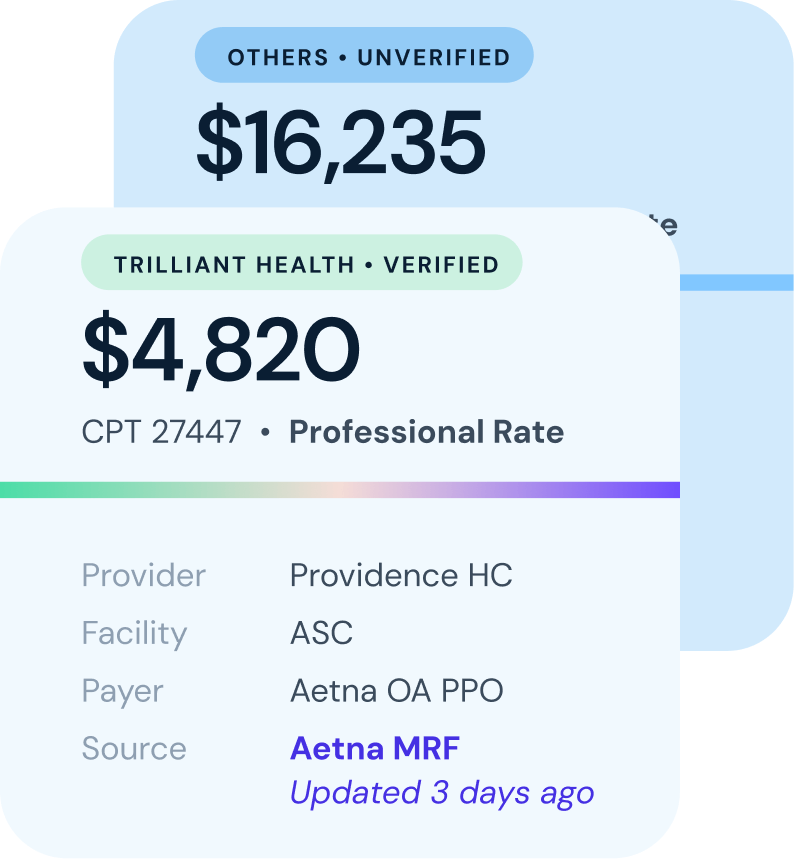
In the new world of healthcare price transparency, every provider will eventually be forced to defend their rate. Doing so first requires navigating the scale and complexity of the MRFs to benchmark your rate against your actual competitors.
WHAT YOU GET
- Facility and professional rates in a single dataset
- Negotiated rates across settings of care
- Duplicate and invalid ("zombie") rates removed
Who are the relevant providers to benchmark rates against?
We group NPIs and billing entities under the parent organization and layer in specialty, location and system affiliation, so you can benchmark against true competitors, not every provider in the MRFs.
WHAT YOU GET
- 40+ provider attributes from our Provider Directory
- Specialty and practice location verified
- Facility type and health system affiliation included
.png?width=400&height=451&name=pt%20image%20for%20green%20card%20png%20(1).png)
How does the variation in rates shape your market position?
A provider paid a lower rate can out-earn a peer with a higher rate simply by performing more services. Understanding market position requires understanding negotiated rates alongside utilization trends and competitive benchmarks.
WHAT YOU GET
- Competitive volume trends by payer and service line
- Rates landed to specific sites of service (state, CBSA, county, ZIP)
- Utilization patterns that reveal payer steerage
.png?width=400&height=451&name=pt%20image%20for%20orange%20card%20png%20(1).png)
Why does that variation exist, and is it sustainable?
Value exists at the intersection of quality outcomes and negotiated rate, and stakeholders who deliver value for money more consistently than their competitors will win in healthcare’s negative-sum game.
Our team offers more than simple technical support. Our in-house payer analytics experts offer strategic support to help translate price variations into a pricing strategy.
WHAT YOU GET
- Validation of negotiated rates by payer-side specialists
- Cohort review to ensure like-for-like comparisons
- Advisory support through the contracting process
.png?width=400&height=454&name=pt%20image%20for%20purple%20card%20png%20(1).png)
GO DEEPER: USE CASES
The Playbook for Growth
The Playbook for Growth examines how strategy teams use price transparency data to support their pricing strategies and negotiations.

01
Benchmarking rates across a market
Negotiating from strength starts with knowing where your rates sit relative to the market, not negotiating on a gut feeling.
02
Understanding the impact of rates on market share
A higher negotiated rate does not guarantee more revenue if it results in lower volume or an unfavorable payer mix.
03
Assessing the impact of steerage to low-cost sites
Payers are steering volume toward lower-cost settings. Know where that exposure is greatest so you can negotiate — or compete — on price.