
Visits data shows how demand at your facilities compares to the competition, with visibility into individual patient journeys and referrals.
Market Intelligence for Healthcare
Answers to your most important
strategy questions.
Our data-driven insights into healthcare demand, supply and yield enable healthcare stakeholders to develop evidence-based strategies.

OUR DATA FOUNDATIONS
The data you need to compete in healthcare's negative-sum game
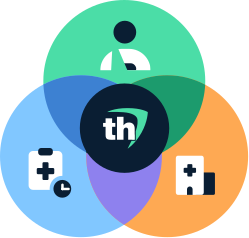
The U.S. health economy is not a growing market in the traditional sense — the pool of commercially insured patients is shrinking every year — so any gain in market share for one stakeholder comes at the expense of another. Because the rules of a negative-sum game are immutable, the status quo is unsustainable and, therefore, a losing strategy. Competing effectively requires understanding your market through three lenses: demand, supply and yield.

DEMAND • VISITS
What care is happening?
Visits data shows how demand at your facilities compares to the competition, with visibility into individual patient journeys and referrals.

SUPPLY • PROVIDERS
Who are the providers?
Provider data includes individual clinicians and healthcare organizations, presents an accurate view of supply in your market.

YIELD • RATES
How much does it cost?
Pricing data across health plans, settings of care and service lines equips stakeholders to deliver (or demand) value for money.
One comprehensive view of your market
OUR RESEARCH
Research on the health economy.
Open to everyone.
TRENDS REPORT • OCTOBER 2026
The U.S. health economy is a textbook case of a tragedy of the commons: it is governed by incentives that reward individual actors for behavior the collective cannot sustain. As it stands, no one is incentivized to improve health.

117.1%
Increase in pediatric visits for pervasive developmental disorders between 2019 and 2025.
70%
The percentage of Americans that believe the healthcare system has major problems or is in a state of crisis.
27%
The amount of quality measure directly tied to outcomes; a feature of a system that monetized volume over outcomes.
FROM OUR FOUNDER
"Every other industry in America uses data to develop evidence-based strategies, and only in healthcare do we rely on state hospital associations to report data from two years ago to decide what we're going to do in 2027."
Hal Andrews · President & CEO, Trilliant Health
The people behind the work
Meet the team...
Learn more about the team that builds the data, writes the research and works alongside clients to put it to use.
 Hal Andrews
President and Chief Executive Officer
President and CEO since Trilliant Health's founding in June 2017, with more than 25 years' experience as an entrepreneur, investor and healthcare business leader.
%20(1).png) Allison Oakes, Ph.D.
Allison Oakes, Ph.D.VP, Chief Research Officer
Brings a comprehensive perspective to the complexities of the U.S. healthcare system. Published in leading medical journals.
 Matt O'Neill
Chief Data Officer, EVP Engineering, Machine Learning, Product
Strives to understand the data problems plaguing the healthcare industry, and how we can apply modern approaches in engineering and data science to solve them.